Gate Research: Web3 On-Chain Data Insights for July 2025|Ethereum On-Chain Activity Rebounds, WorldChain Sees Strong Inflows
Abstract
- Ethereum trading volume hit a new high, while Solana and Base led in on-chain activity and transaction volume driven by high-frequency applications such as xStocks and stablecoin payments, highlighting the continued divergence among public chain ecosystems.
- Ethereum maintained its lead in net inflows among public chains, while WorldChain surged to second place with strong capital attraction, boosted by cross-chain integration and World ID-driven ecosystem growth, becoming the most watched emerging chain of the month.
- During Bitcoin’s high-level consolidation, its realized market cap reached an all-time high, indicating steady capital inflows and a robust market structure; however, rising profit-taking intensity and an increasing share of short-term supply suggest growing sell pressure and heightened volatility expectations.
- LetsBonk.fun surpassed Pump.fun across July to become the leading meme coin launch platform on Solana, thanks to breakout projects like USELESS, a transparent revenue-sharing model, and strong user momentum.
- ENA solidified its leadership in the stablecoin sector with explosive growth of USDe, buyback initiatives, and institutional partnerships. While short-term token unlocks may introduce volatility, its strong fundamentals support sustained medium-to-long-term upside potential.
On-Chain Insights Overview
Overview of On-Chain Activity and Capital Flow
In addition to analyzing overall on-chain capital flows, we further selected several key on-chain activity metrics to assess the actual usage and engagement levels across blockchain ecosystems. These indicators include daily transaction volume, daily gas fees, daily active addresses, and net cross-chain bridge flows—capturing user behavior, network utilization intensity, and asset mobility. Compared to observing capital inflows and outflows alone, these native on-chain data points provide a more comprehensive reflection of fundamental shifts in blockchain ecosystems. They help determine whether capital flows are accompanied by genuine user demand and growth, enabling identification of networks with sustainable development potential.
Transaction Volume Analysis: Ethereum Hits Record High, Solana and Base Lead High-Frequency Interaction Landscape
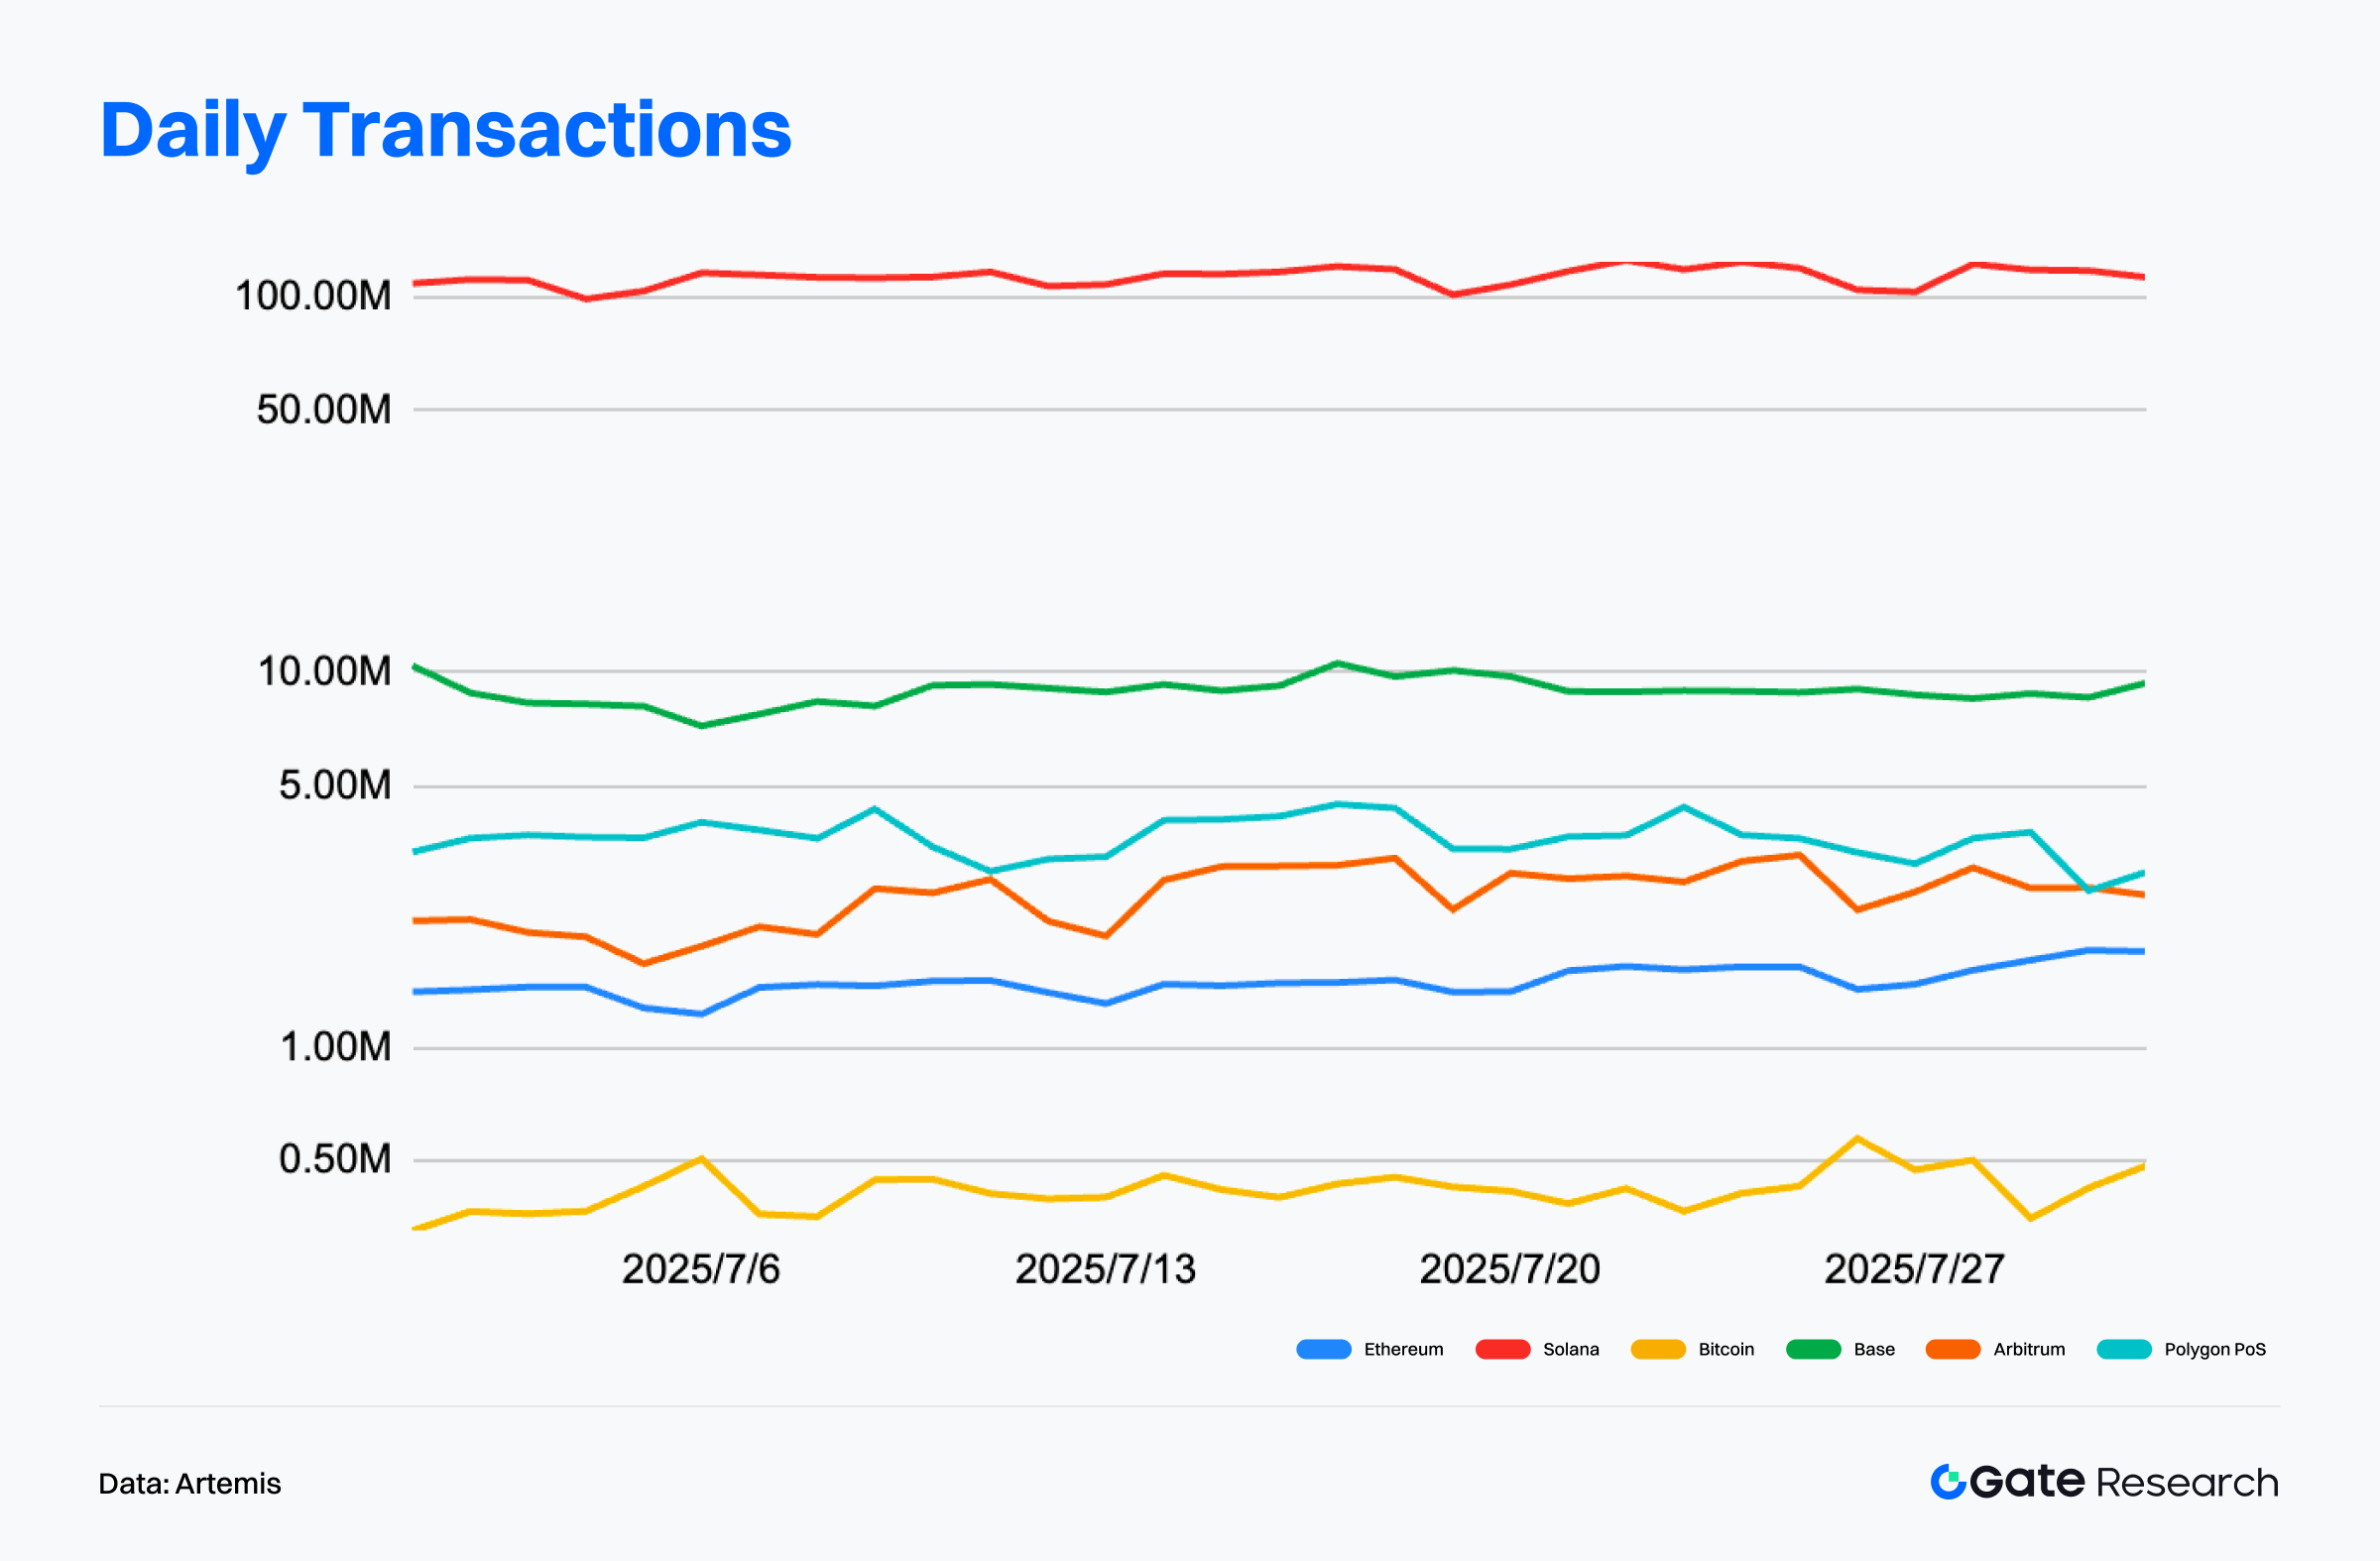
According to data from Artemis, as of July 31, 2025, Solana recorded approximately 35.3 billion monthly transactions, maintaining a commanding lead among major public blockchains. Its July transaction volume surged by around 30% month-over-month. Beyond its established structure of high-frequency micro-transactions, increased activity from tokenized assets like xStocks and ecosystem airdrops further fueled on-chain demand. Solana’s daily transaction volume remained stable between 90 to 100 million, with low volatility, reflecting strong user engagement and stickiness on-chain.【1】
Base ranked second with 2.78 billion transactions, maintaining the top spot among Layer 2 solutions. Its overall trend was steady, with average daily transaction volume ranging between 9 to 10 million, indicating consistent growth in native application usage. Base’s transaction structure balances frequency and depth, forming a solid network economy supported by native USDC payments, a thriving DeFi ecosystem, and the ongoing institutional shift to on-chain infrastructure.
Ethereum ranked fifth with 46.67 million monthly transactions, but it set a new all-time high—up 3.6% from its previous peak in May 2021. Its 7-day moving average of daily transactions also neared historical highs, reaching 1.64 million, just below the 1.66 million peak from May 2021. As on-chain activity surged, ETH prices climbed to a multi-year high of 3,700 USDT by the end of July. Despite Ethereum’s higher average transaction value, its daily transaction count remained around 1.5 million, constrained by gas fees and Layer 2 offloading.
In summary, Ethereum posted its highest transaction volume in four years. Solana continued to dominate the on-chain transaction landscape with unmatched interaction frequency and extensive ecosystem coverage, demonstrating exceptional scalability. Base stood out among Layer 2 networks, with a stable and steadily growing transaction structure. Both networks exhibit characteristics of structural stability, authentic user engagement, and diverse applications, making them the most resilient performers in current on-chain activity. Overall, on-chain transaction volumes are increasingly showing a structural divergence between “high-frequency retail chains” and “low-frequency high-value chains.”
Active Address Analysis: Solana Tops with 4.42M Daily Actives, Base Sees Steady Growth
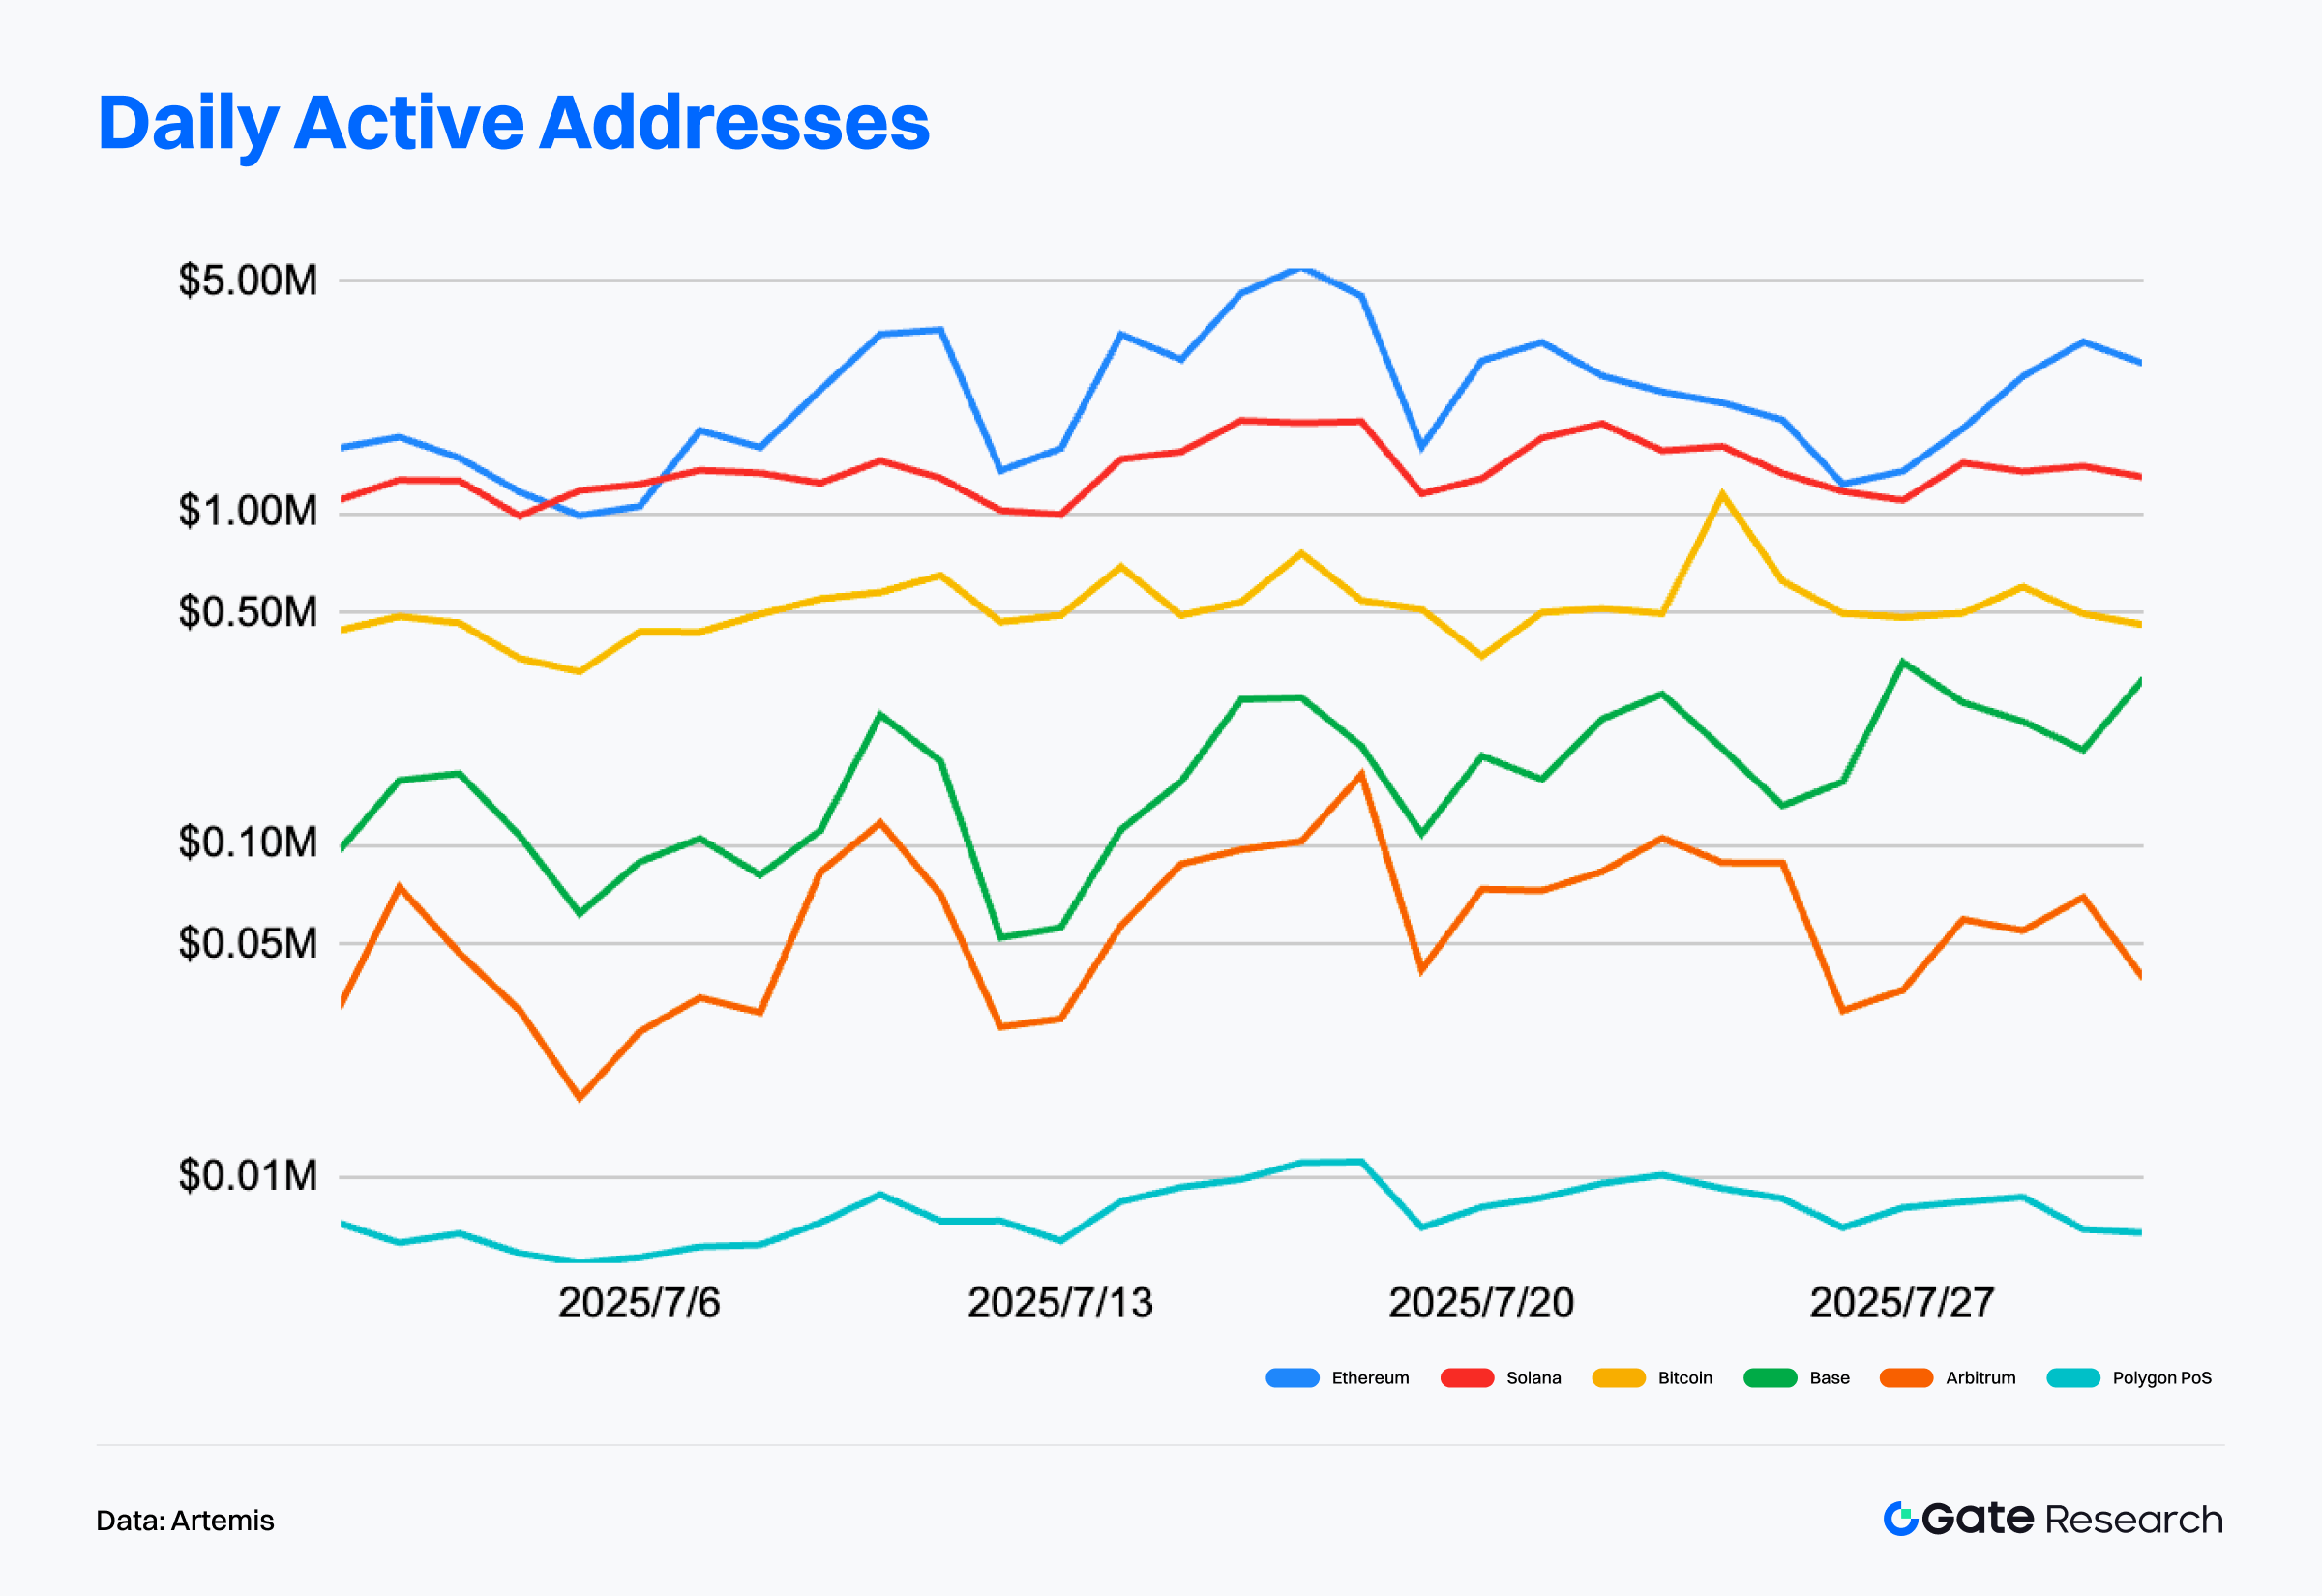
According to data from Artemis, as of July 31, 2025, Solana maintained its lead in the public blockchain ecosystem with an average of 4.42 million daily active addresses. Although slightly lower than the previous month, it remains far ahead of all other Layer 1 and Layer 2 networks. Solana’s user base is gradually shifting from speculation-driven activity to real-world applications. A key driver of this shift is xStocks—a tokenized stock product launched by Backed Finance—that converts equities into SPL tokens on a 1:1 basis. These tokens are now tradable on platforms like Gate and can be withdrawn for participation in on-chain DeFi activities, significantly expanding asset utility and boosting Solana’s stickiness and engagement.【2】
Base followed in second place with 1.44 million daily active addresses. Despite a slight dip from June, the overall trend remains steady, indicating a transition from rapid growth to structural expansion. Base’s activity is underpinned by three ongoing drivers: continuous launches of native Dapps, increasing adoption of USDC payments, and high-value interactions driven by financial institutions. These factors are positioning Base as a full-stack application ecosystem.
In contrast, Ethereum and Arbitrum saw relatively muted user activity in July, with daily averages of 480,000 and 340,000 addresses, respectively. However, Ethereum’s total monthly active addresses reached 17.55 million, marking its highest level since May 2021. While Ethereum continues to face challenges from high gas fees and user friction, leading to migration toward more affordable Layer 2 solutions, the upcoming launch of tokenized stock assets by social investment platform eToro could revive its user engagement by introducing new asset issuance use cases, leveraging eToro’s massive user base.
Overall, the active address data reflects ongoing divergence between chains. Solana and Base stand out in the Layer 1 and Layer 2 categories, respectively, demonstrating strong user aggregation and ecosystem pull. In contrast, legacy networks risk continued user attrition unless they introduce novel applications or lower entry barriers. As active address trends reveal both current engagement and future capital and developer focus, their structural evolution remains a key metric to watch.
On-Chain Fee Analysis: Ethereum Dominates High-Value Use Cases, While Solana and Layer 2s Expand High-Frequency Income
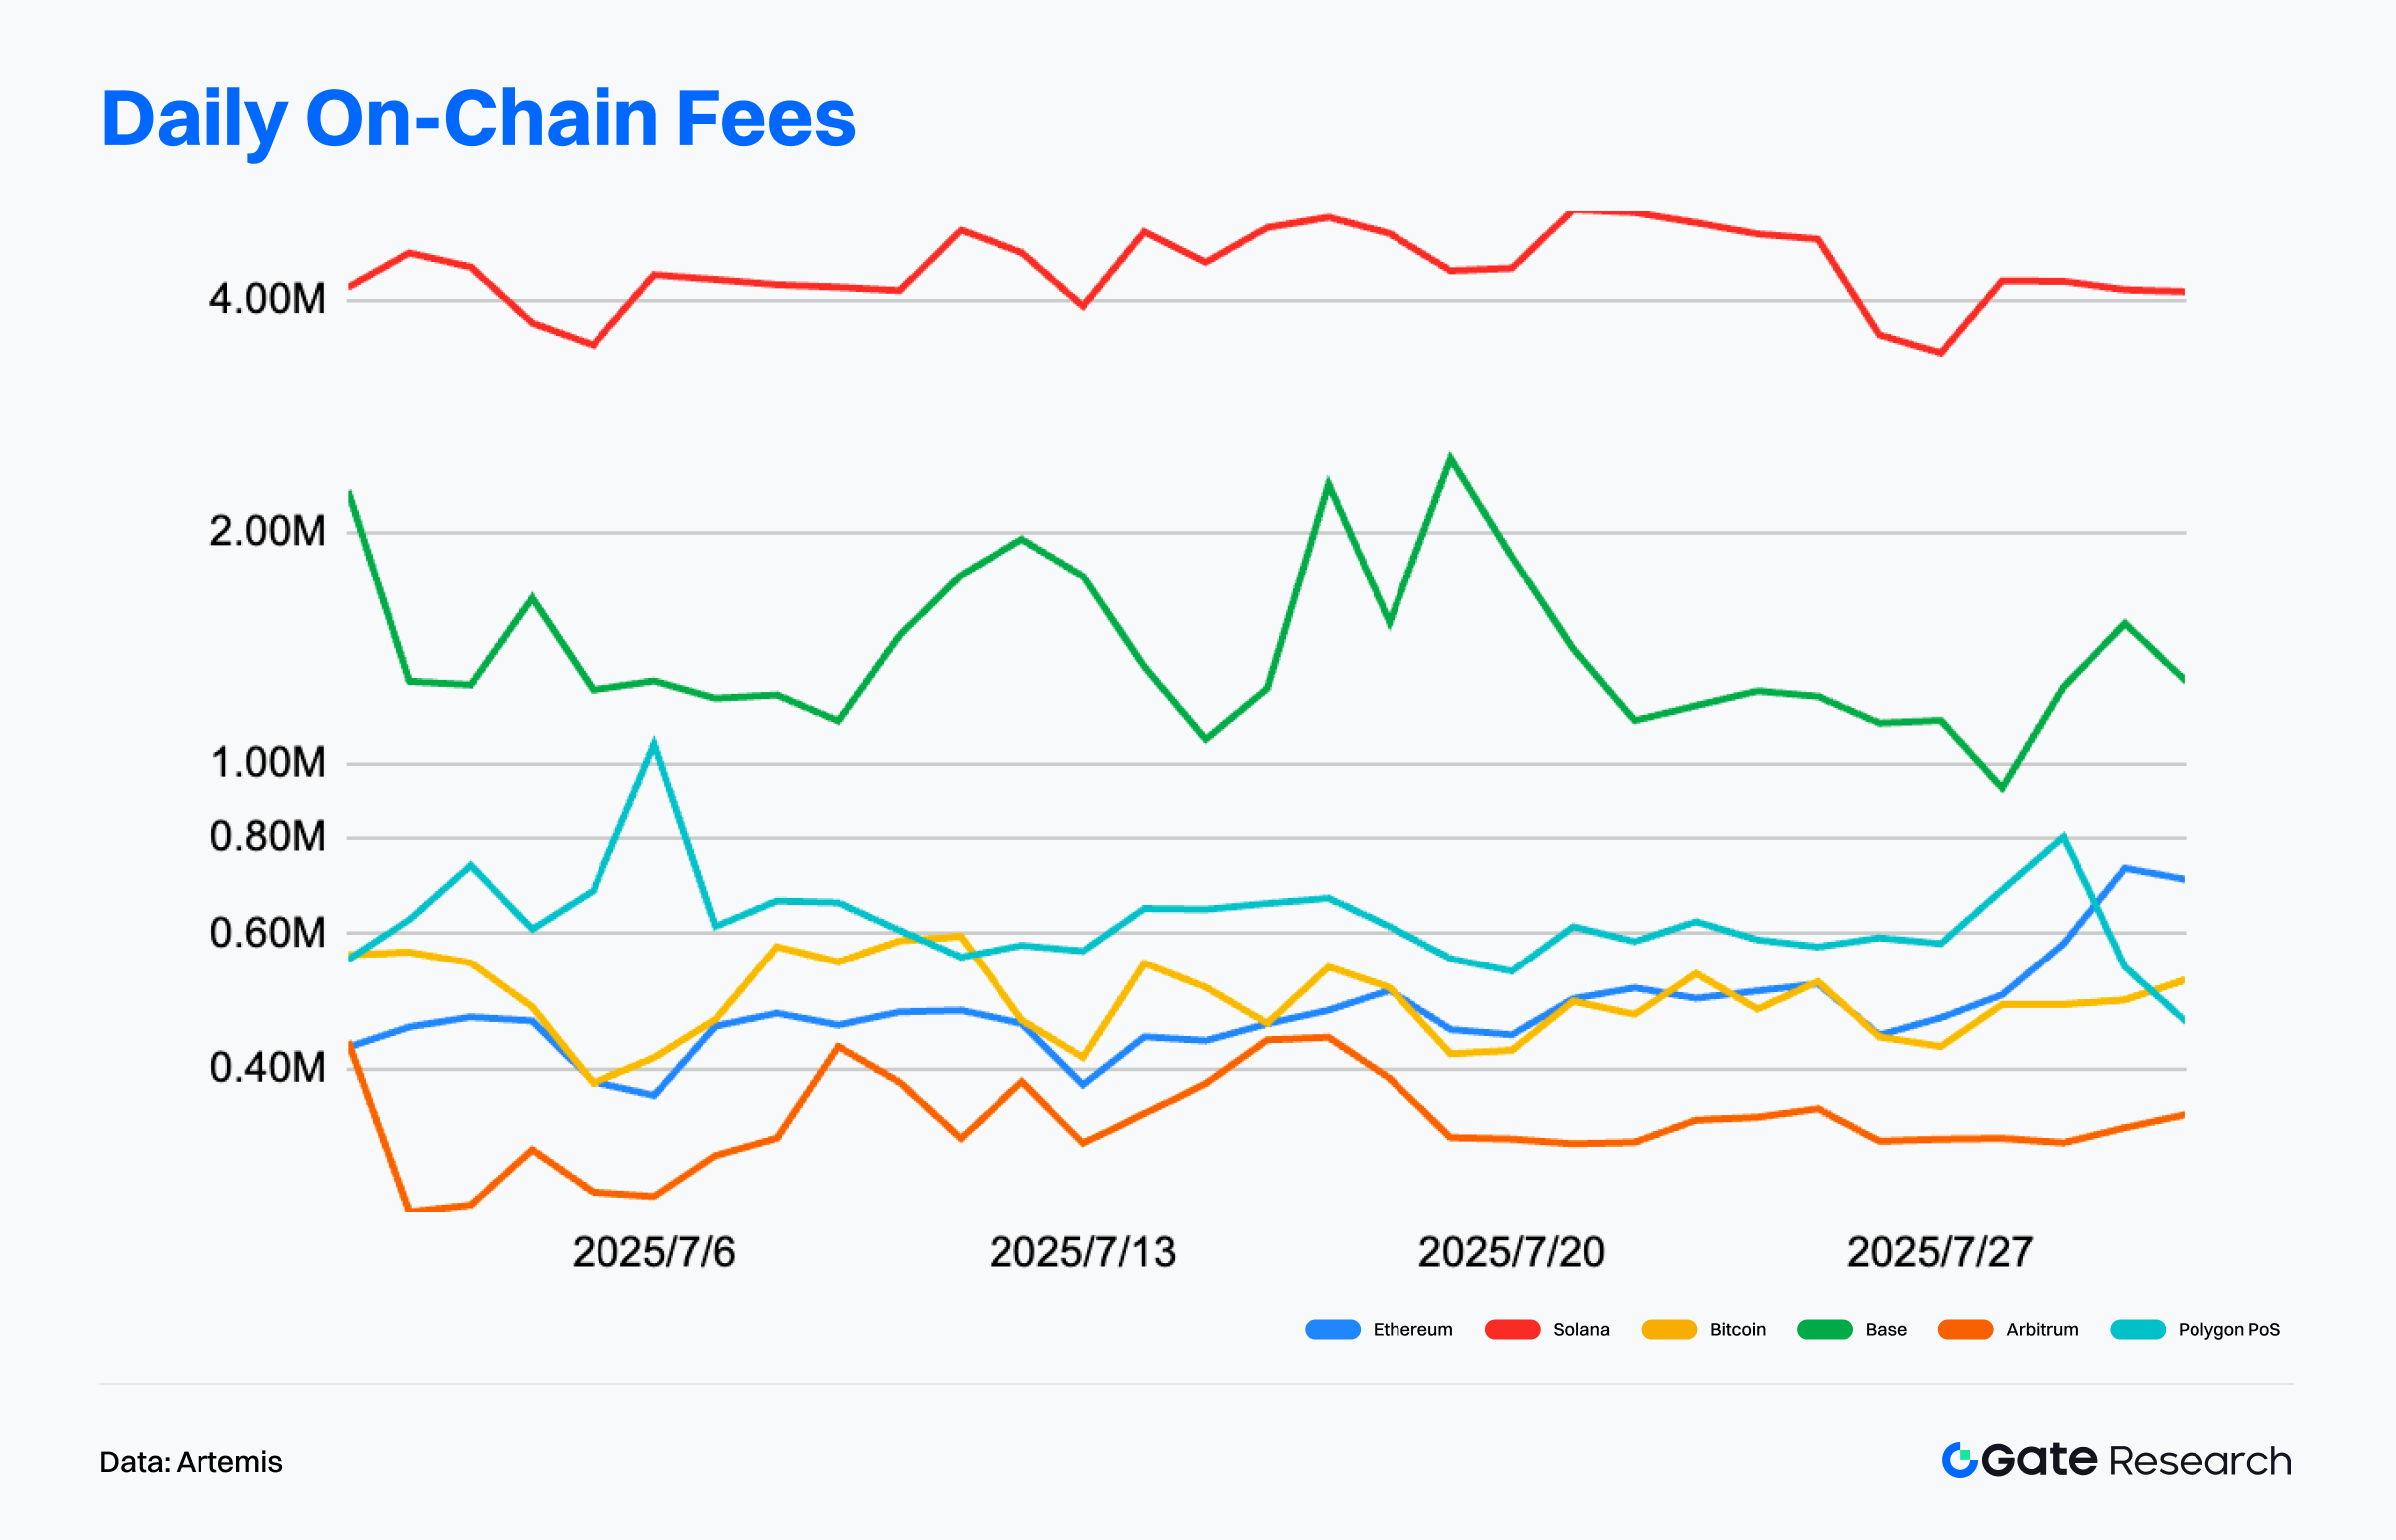
According to Artemis data, as of July 31, 2025, Ethereum led all networks with $74.28 million in monthly fee revenue, underscoring its dominance in high-value transactions, DeFi, and NFT settlements. Despite having lower user activity than Solana, Ethereum’s high interaction density and large average transaction value give it a clear advantage in revenue generation.【3】
Solana ranked second with $42.3 million in monthly fees. While individual transaction fees remain low, the chain’s large user base and frequent bot interactions have driven stable revenue growth. Solana continues to benefit from high-frequency, microtransaction-heavy use cases such as meme coin issuance, automated trading, and payment scenarios.
Base and Arbitrum ranked fourth and fifth with $5.34 million and $1.97 million in monthly revenue, respectively—demonstrating that emerging Layer 2 networks are beginning to develop independent income streams. Base’s revenue trend mirrors its user activity growth, supported by increasing stablecoin payment adoption and native Dapp usage. While Arbitrum’s user base is smaller than Base’s, it retains meaningful interaction stickiness, reflecting its ecosystem depth.
Overall, the current fee revenue landscape highlights a dual-engine model of “high-value interactions” and “high-frequency micro-interactions”:Ethereum maintains a significant lead by anchoring high-net-worth use cases. Solana drives notable revenue through extremely high interaction volume. Base and Arbitrum, as rising Layer 2 networks, are progressively developing sustainable monetization models and showing structural growth potential. Going forward, the ability to generate sustainable on-chain fee revenue will be a key indicator of each chain’s ecosystem self-sufficiency and the viability of their token economic models.
Public Chain Capital Flow Analysis: Ethereum Maintains Lead as WorldChain Surges into the Spotlight
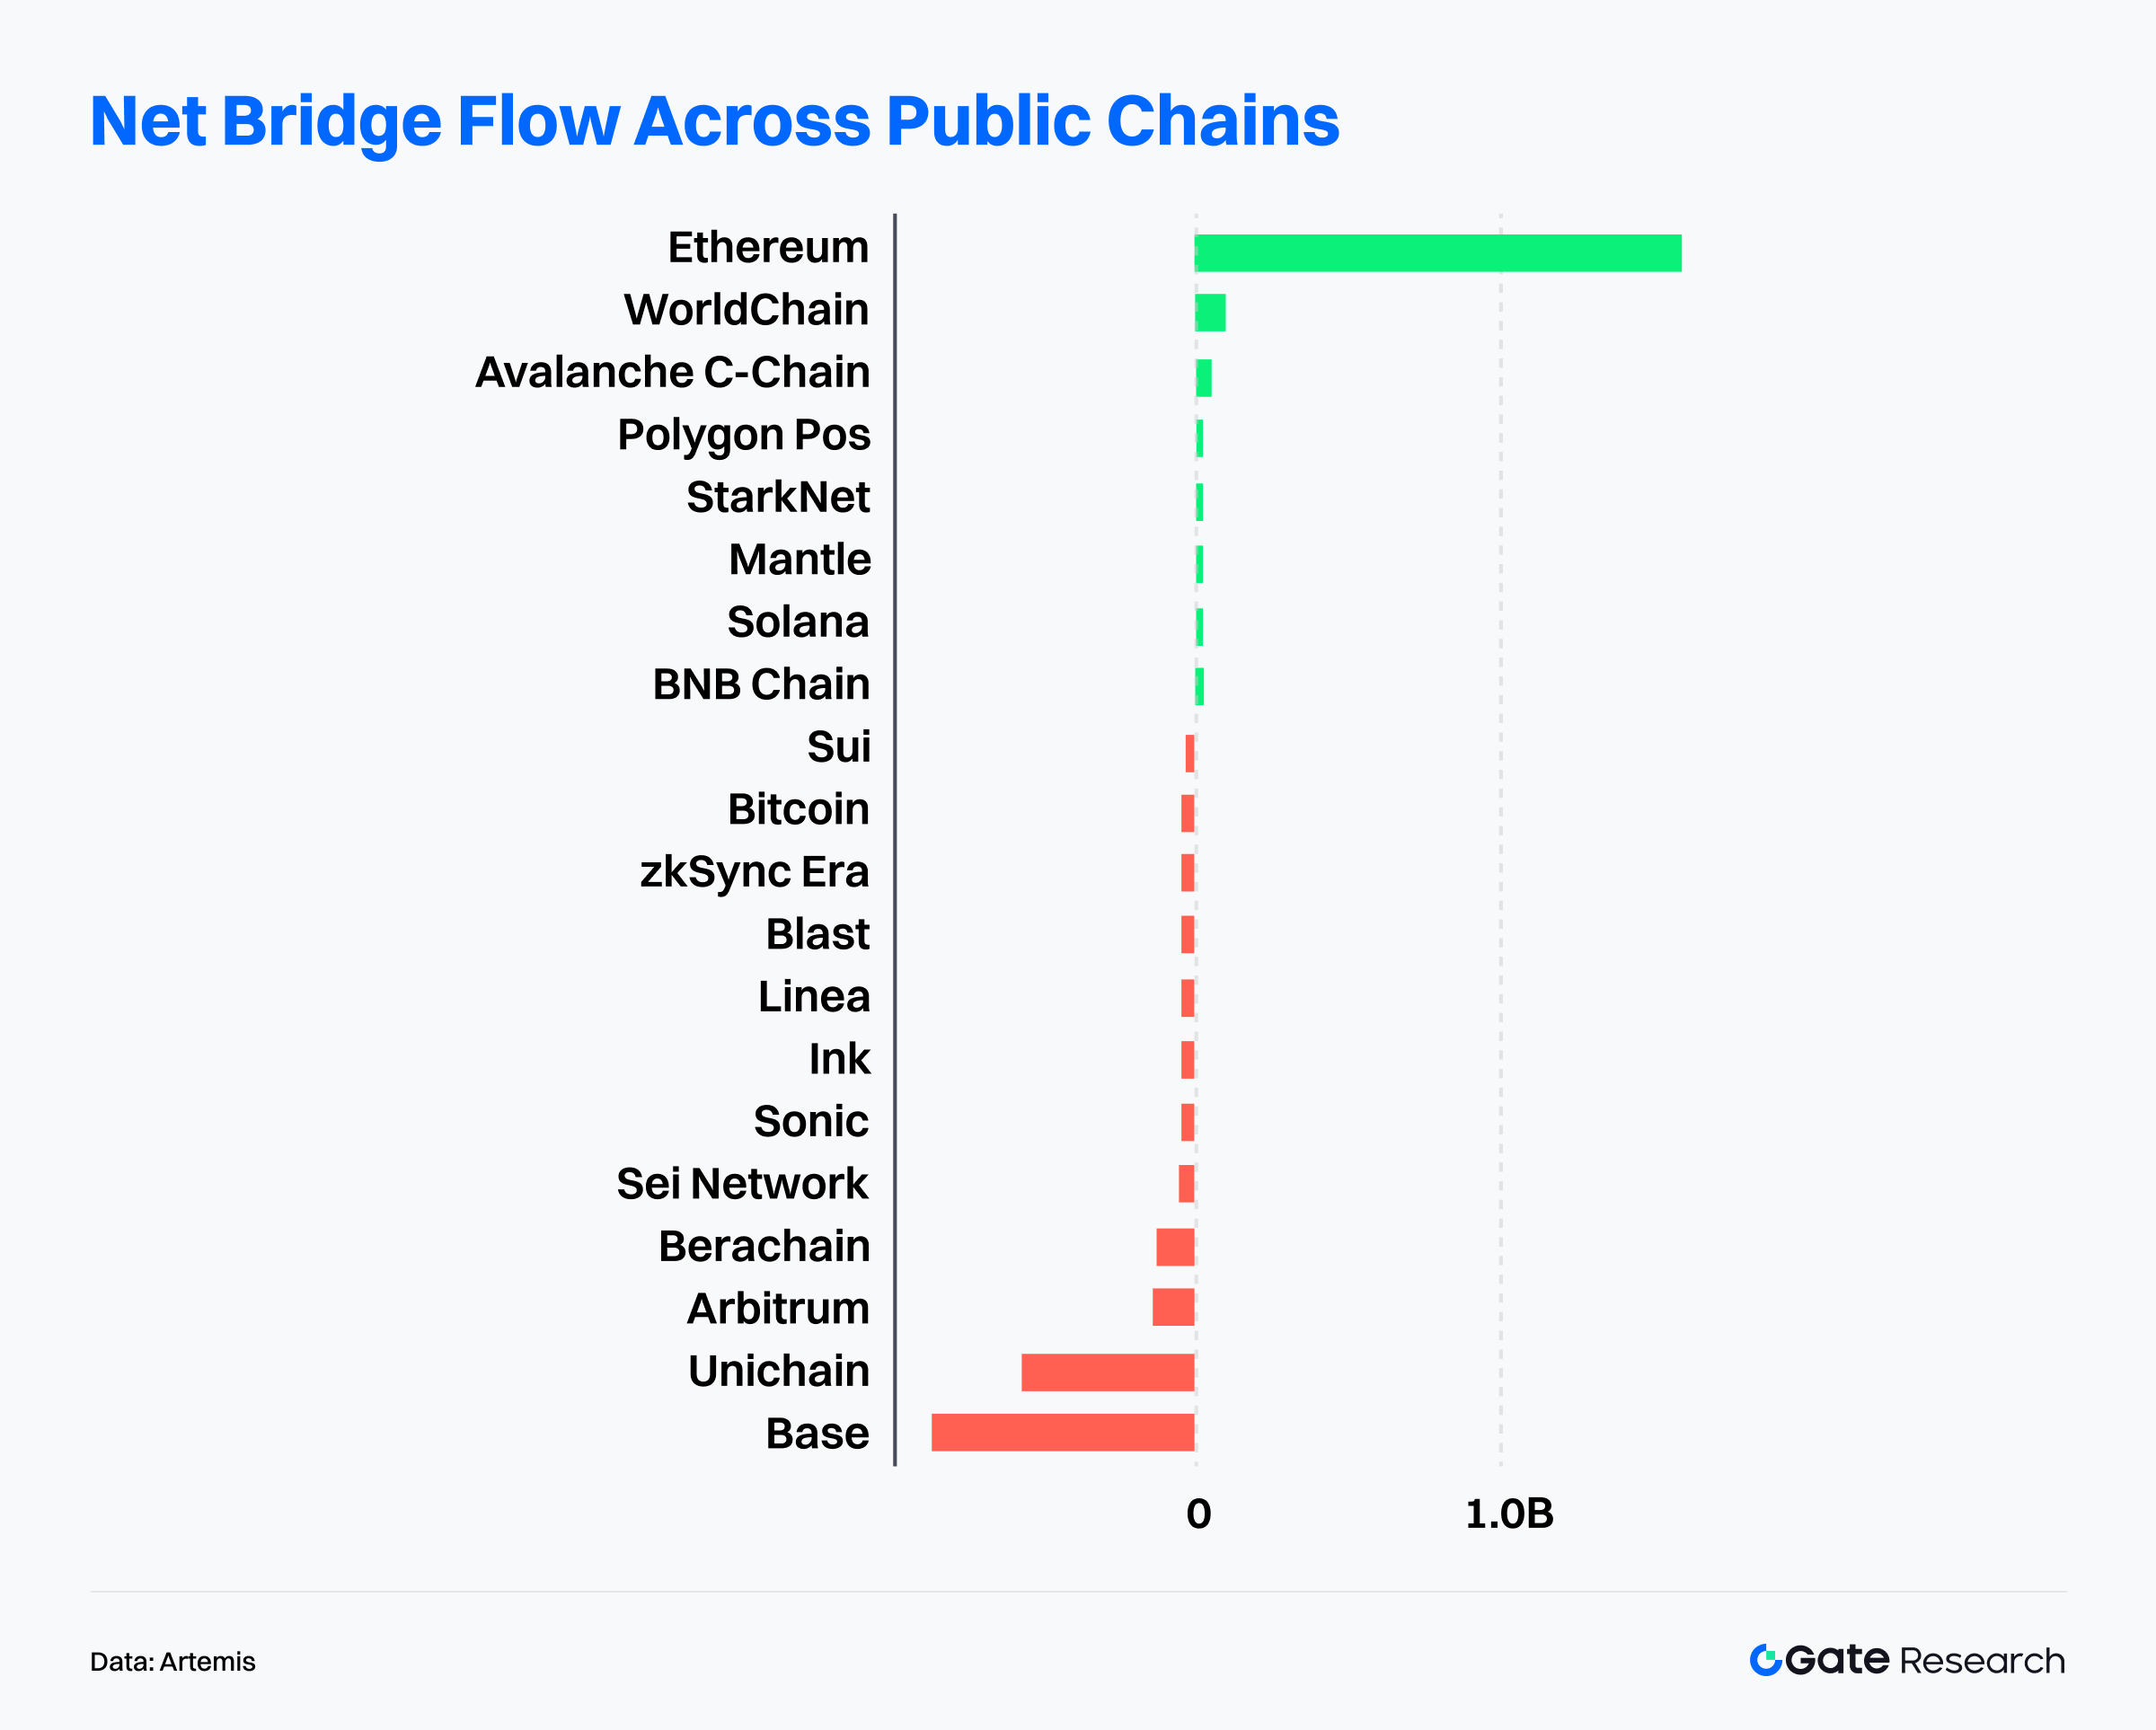
According to data from Artemis, Ethereum maintained its dominance in public chain capital flows with a net inflow of $1.6 billion over the past month, underscoring its overwhelming advantage in institutional deployment and ecosystem depth. Notably, emerging contender WorldChain attracted significant attention by securing $113 million in net inflows this month, propelled by its close cross-chain integration with Ethereum mainnet. This strong performance positioned WorldChain ahead of Avalanche ($67.1 million) and Polygon PoS ($43.7 million), making it the most watched up-and-coming chain of the month.【4】
In contrast, Base recorded a substantial net outflow of $859 million—the largest among all public chains this month—indicating a notable shift in market sentiment. This may be tied to short-term valuation corrections, declining ecosystem activity, or the wind-down of early incentive programs. Unichain (-$560 million) and Arbitrum (-$132 million) also saw significant capital outflows, reflecting a broader market phase of increased high-frequency arbitrage and risk-averse capital rotation, with faster shifts between ecosystems and more pronounced sector rotations.
WorldChain’s capital inflow is not merely driven by short-term hype but is accompanied by the continued expansion of its core infrastructure. At the heart of this is World ID—its decentralized identity protocol based on iris scanning technology—which offers human verification services across more than 160 countries and regions. To date, World ID has verified over 14 million unique identities, with total users exceeding 30 million, positioning itself as a crucial solution to the “human vs. machine” dilemma in the AI era.
In summary, while Ethereum remains the primary hub for capital and institutional activity, WorldChain is rapidly building a high-potential ecosystem with strong network effects, supported by steady inflows, 43.55% TVL growth this month, and the expansion of World ID. Amid intensifying competition in the public chain landscape, WorldChain’s rise is worth close observation. Whether it can sustain this momentum, retain users, and attract long-term developer support will be critical to determining its lasting value.【5】
Key Bitcoin Metrics Analysis
Against the backdrop of cross-chain capital rotation, Bitcoin—serving as the market’s core anchor asset—is simultaneously exhibiting multiple structural on-chain signals, suggesting deep adjustments in market structure and capital behavior. Since reaching an all-time high of 123,000 USDT in mid-July, Bitcoin has entered a phase of high-level consolidation, making shifts in on-chain capital structures and supply dynamics increasingly crucial.
To better assess the underlying support and evolving risks in this elevated price zone, this analysis focuses on three key on-chain indicators: Realized Cap & Net Position Change, Realized Profit/Loss Ratio and LTH/STH Supply Ratio. By cross-referencing these metrics, we aim to uncover insights into market distribution, supply-side pressure, and structural absorption capacity—offering a forward-looking perspective on potential price action.
BTC Realized Cap Hits All-Time High, On-Chain Structure Continues to Strengthen
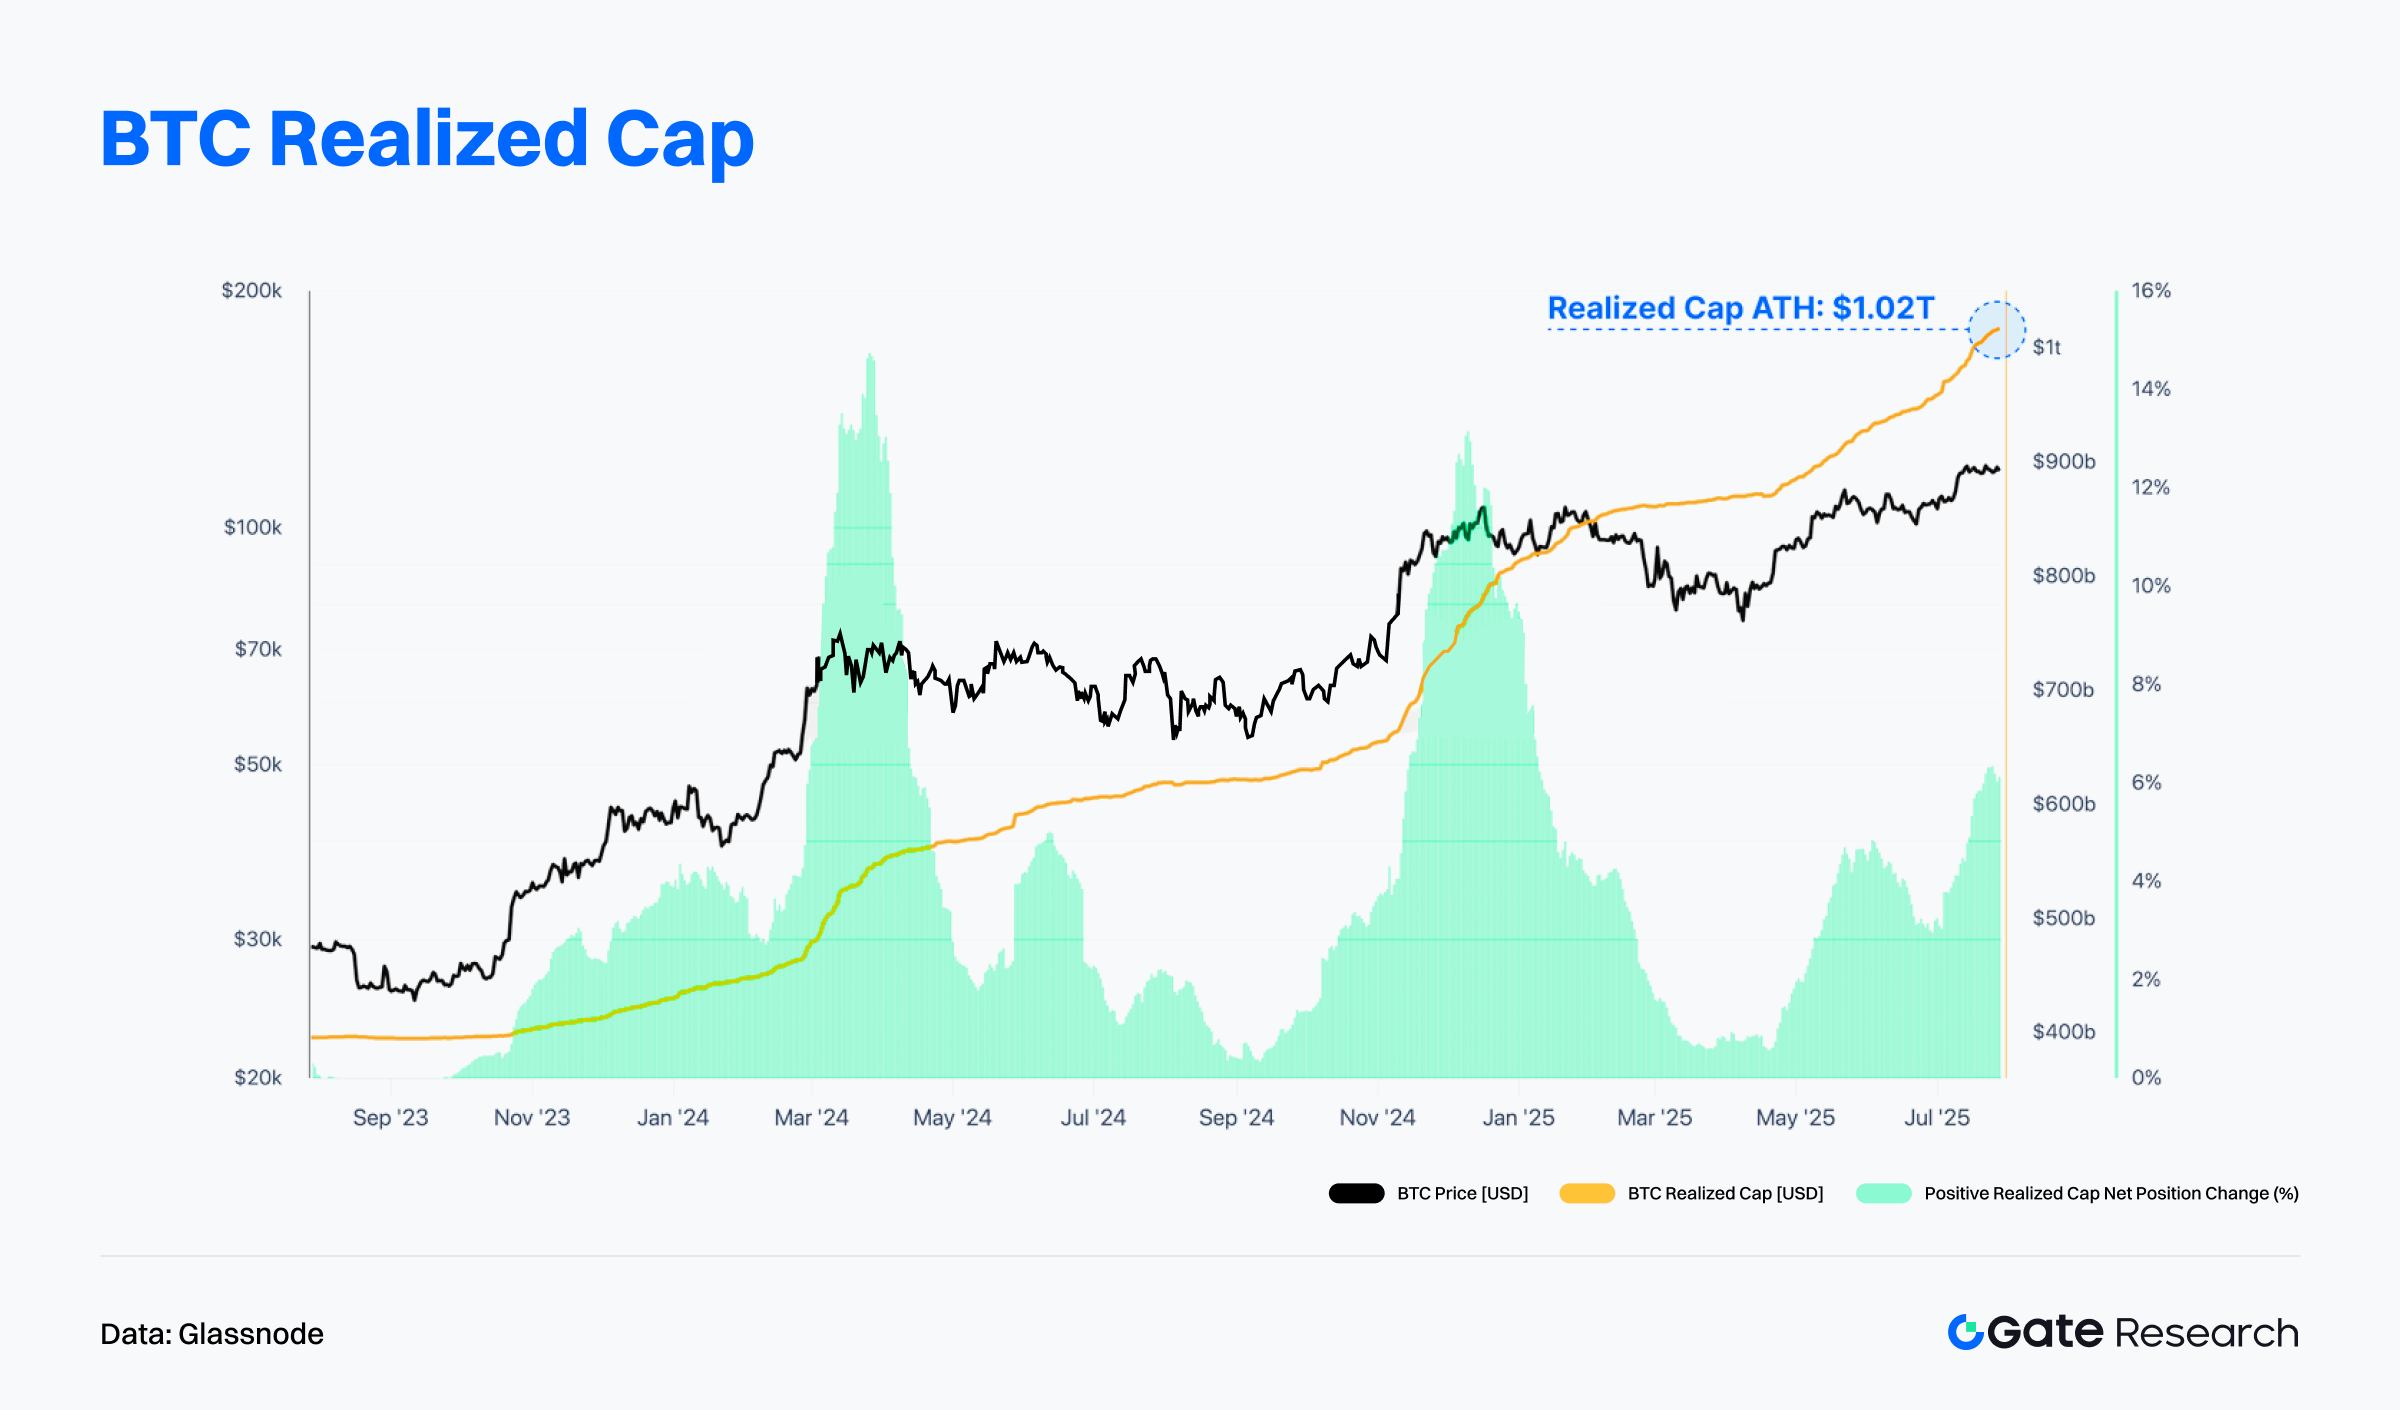
According to Glassnode data, Bitcoin’s realized market capitalization has reached a historic high of over $1.02 trillion, reflecting ongoing improvements in capital structure and rising cost basis among long-term holders. The green zone in the chart represents the Realized Cap Net Position Change %, which measures the strength of new capital entering the market at higher acquisition costs. Since late June, this metric has shown a clear upward trend, signaling sustained inflows and a more robust market structure.
Despite BTC spot prices consolidating in a high range between $115,000 and $123,000 USDT since early July, the continued rise in realized cap suggests that coins are still changing hands at elevated levels—without triggering significant selling pressure. This trend points to increasing long-term holder confidence and ongoing institutional demand.
Supporting this interpretation is the example of an early Bitcoin investor who distributed 80,000 BTC via Galaxy Digital. The market’s ability to absorb this large transaction—even during a low-liquidity weekend trading window—demonstrates strong liquidity depth and structural resilience. Prices remained stable, highlighting the market’s capacity to digest sizable flows and maintain bull market momentum. If the trend of net capital inflows continues, Bitcoin may be poised for a structural breakout in the near future.【6】
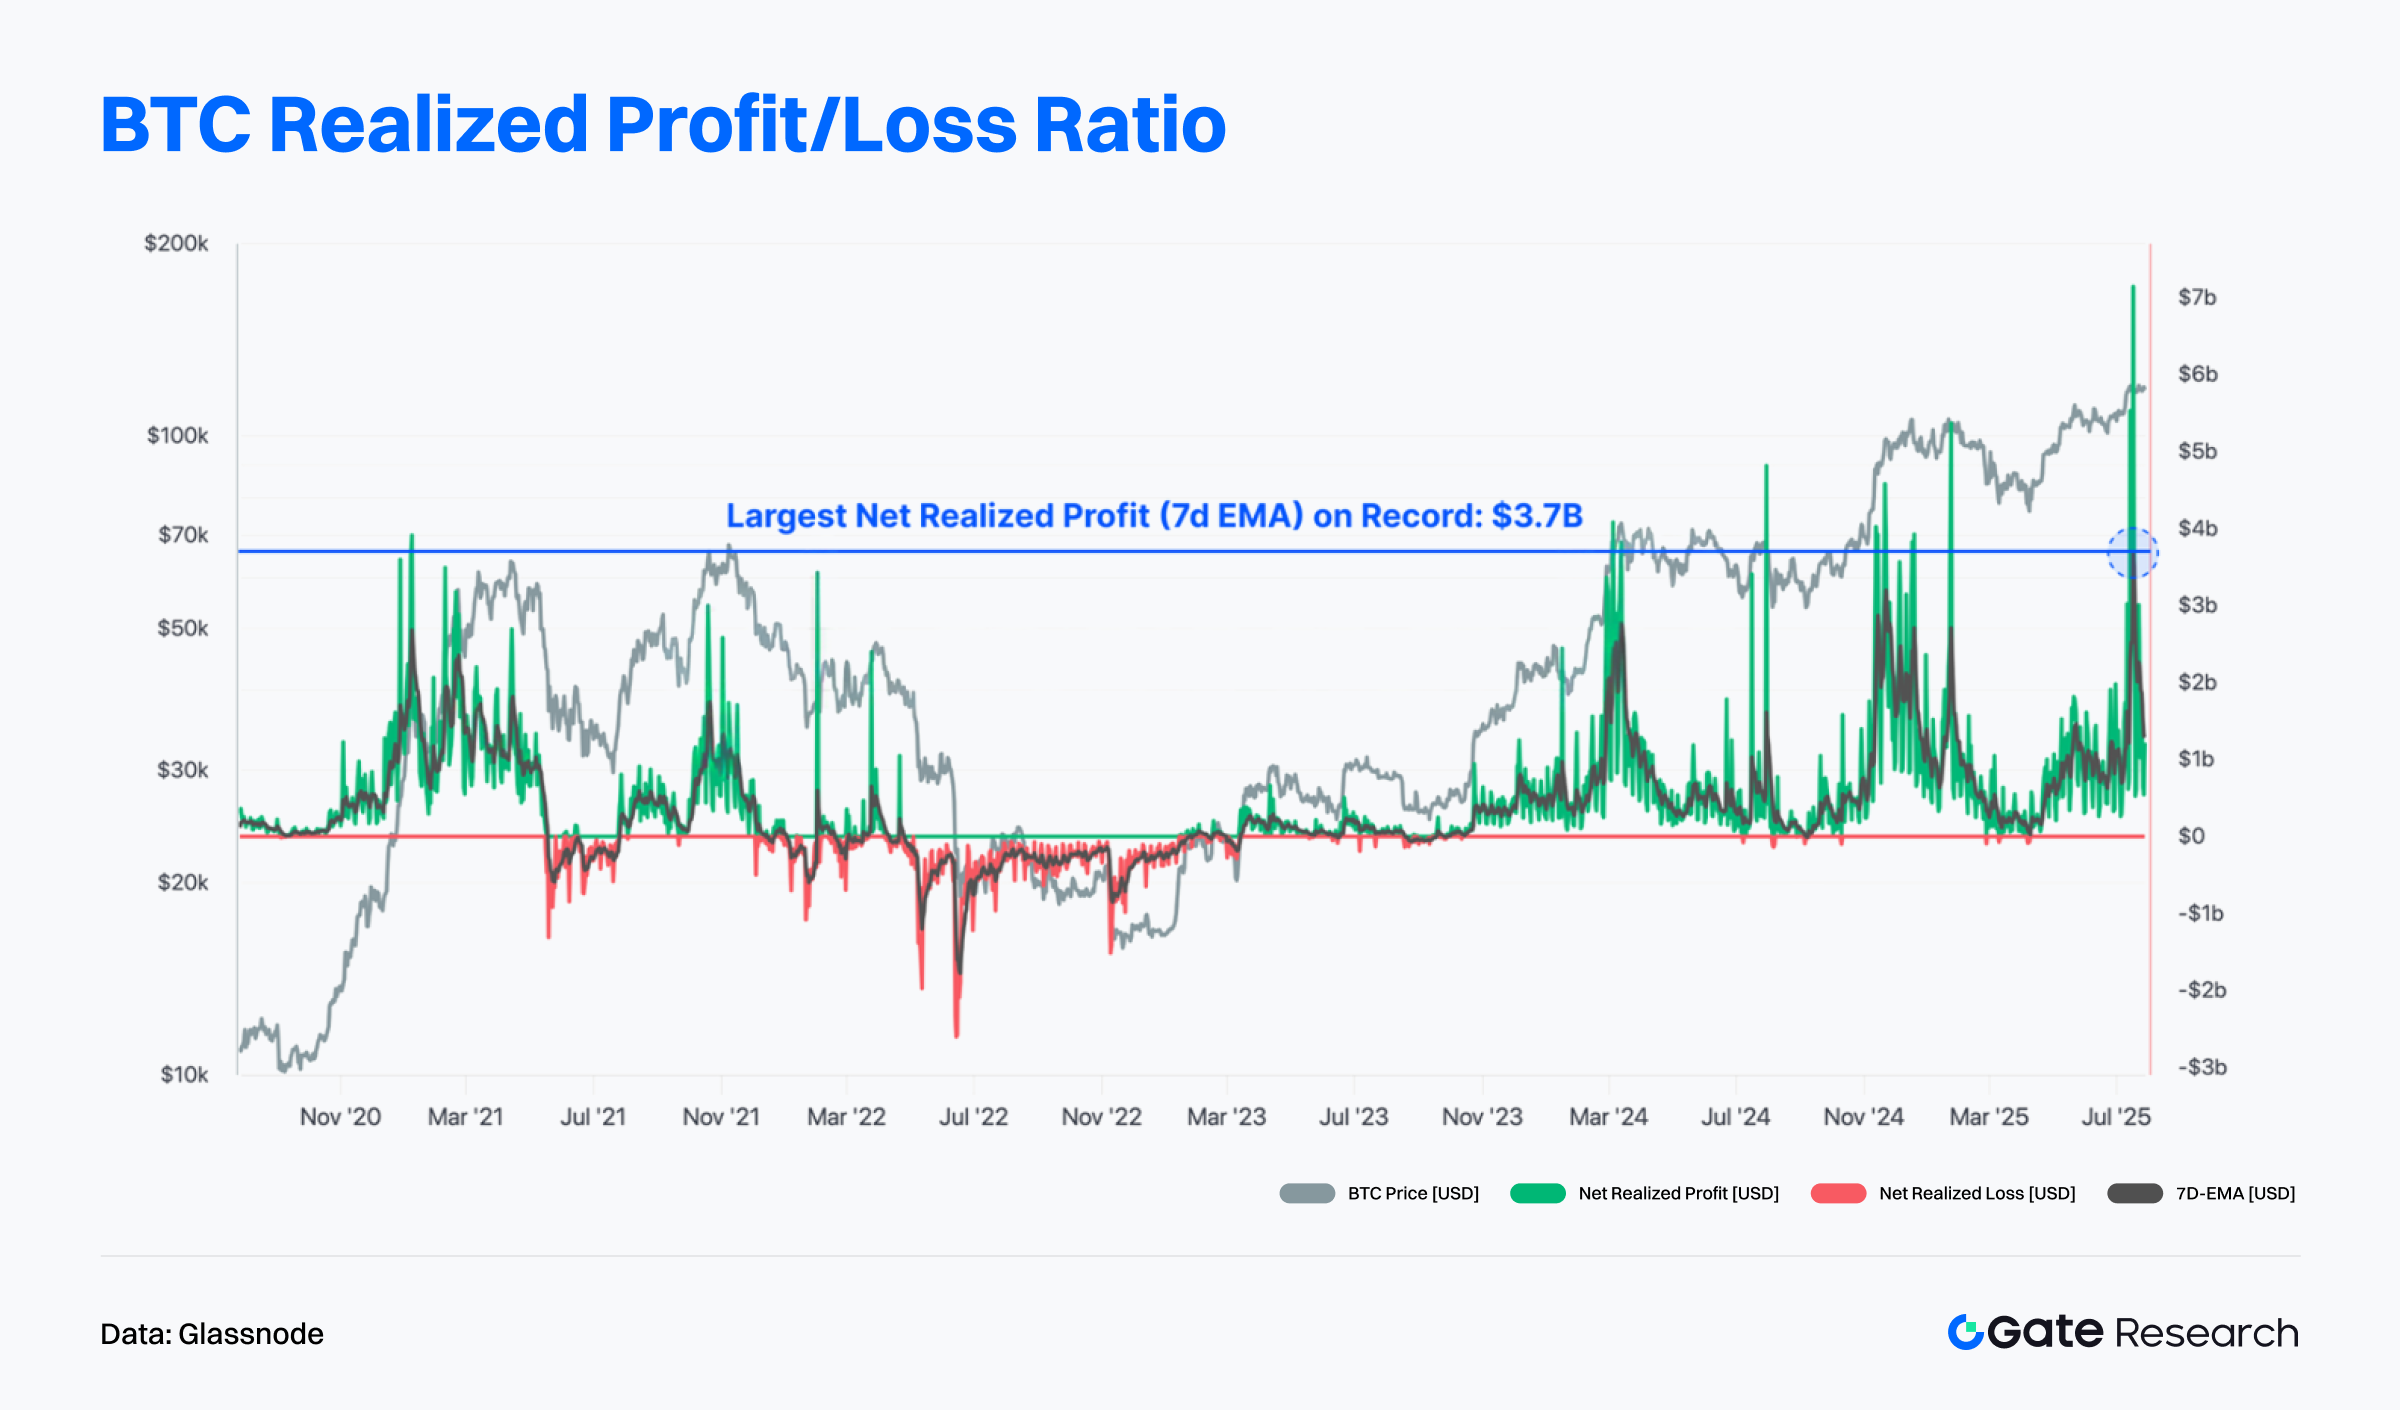
The recent distribution of 80,000 BTC led to a sharp spike in the Net Realized Profit/Loss metric, hitting an all-time high of $3.7 billion. This on-chain fluctuation occurred before the actual weekend sell-off, indicating that some capital movements began even prior to the final transfer. Initially, this batch of BTC was categorized by on-chain heuristics as internal transfers. However, once these assets were subsequently moved via Galaxy Digital, the transactions were reclassified as economically meaningful deliveries—signifying a true change of ownership and transfer of Bitcoin holdings.【7】
BTC Realized Profit/Loss Ratio Hits Extreme Levels, Indicating Rising Short-Term Supply Pressure
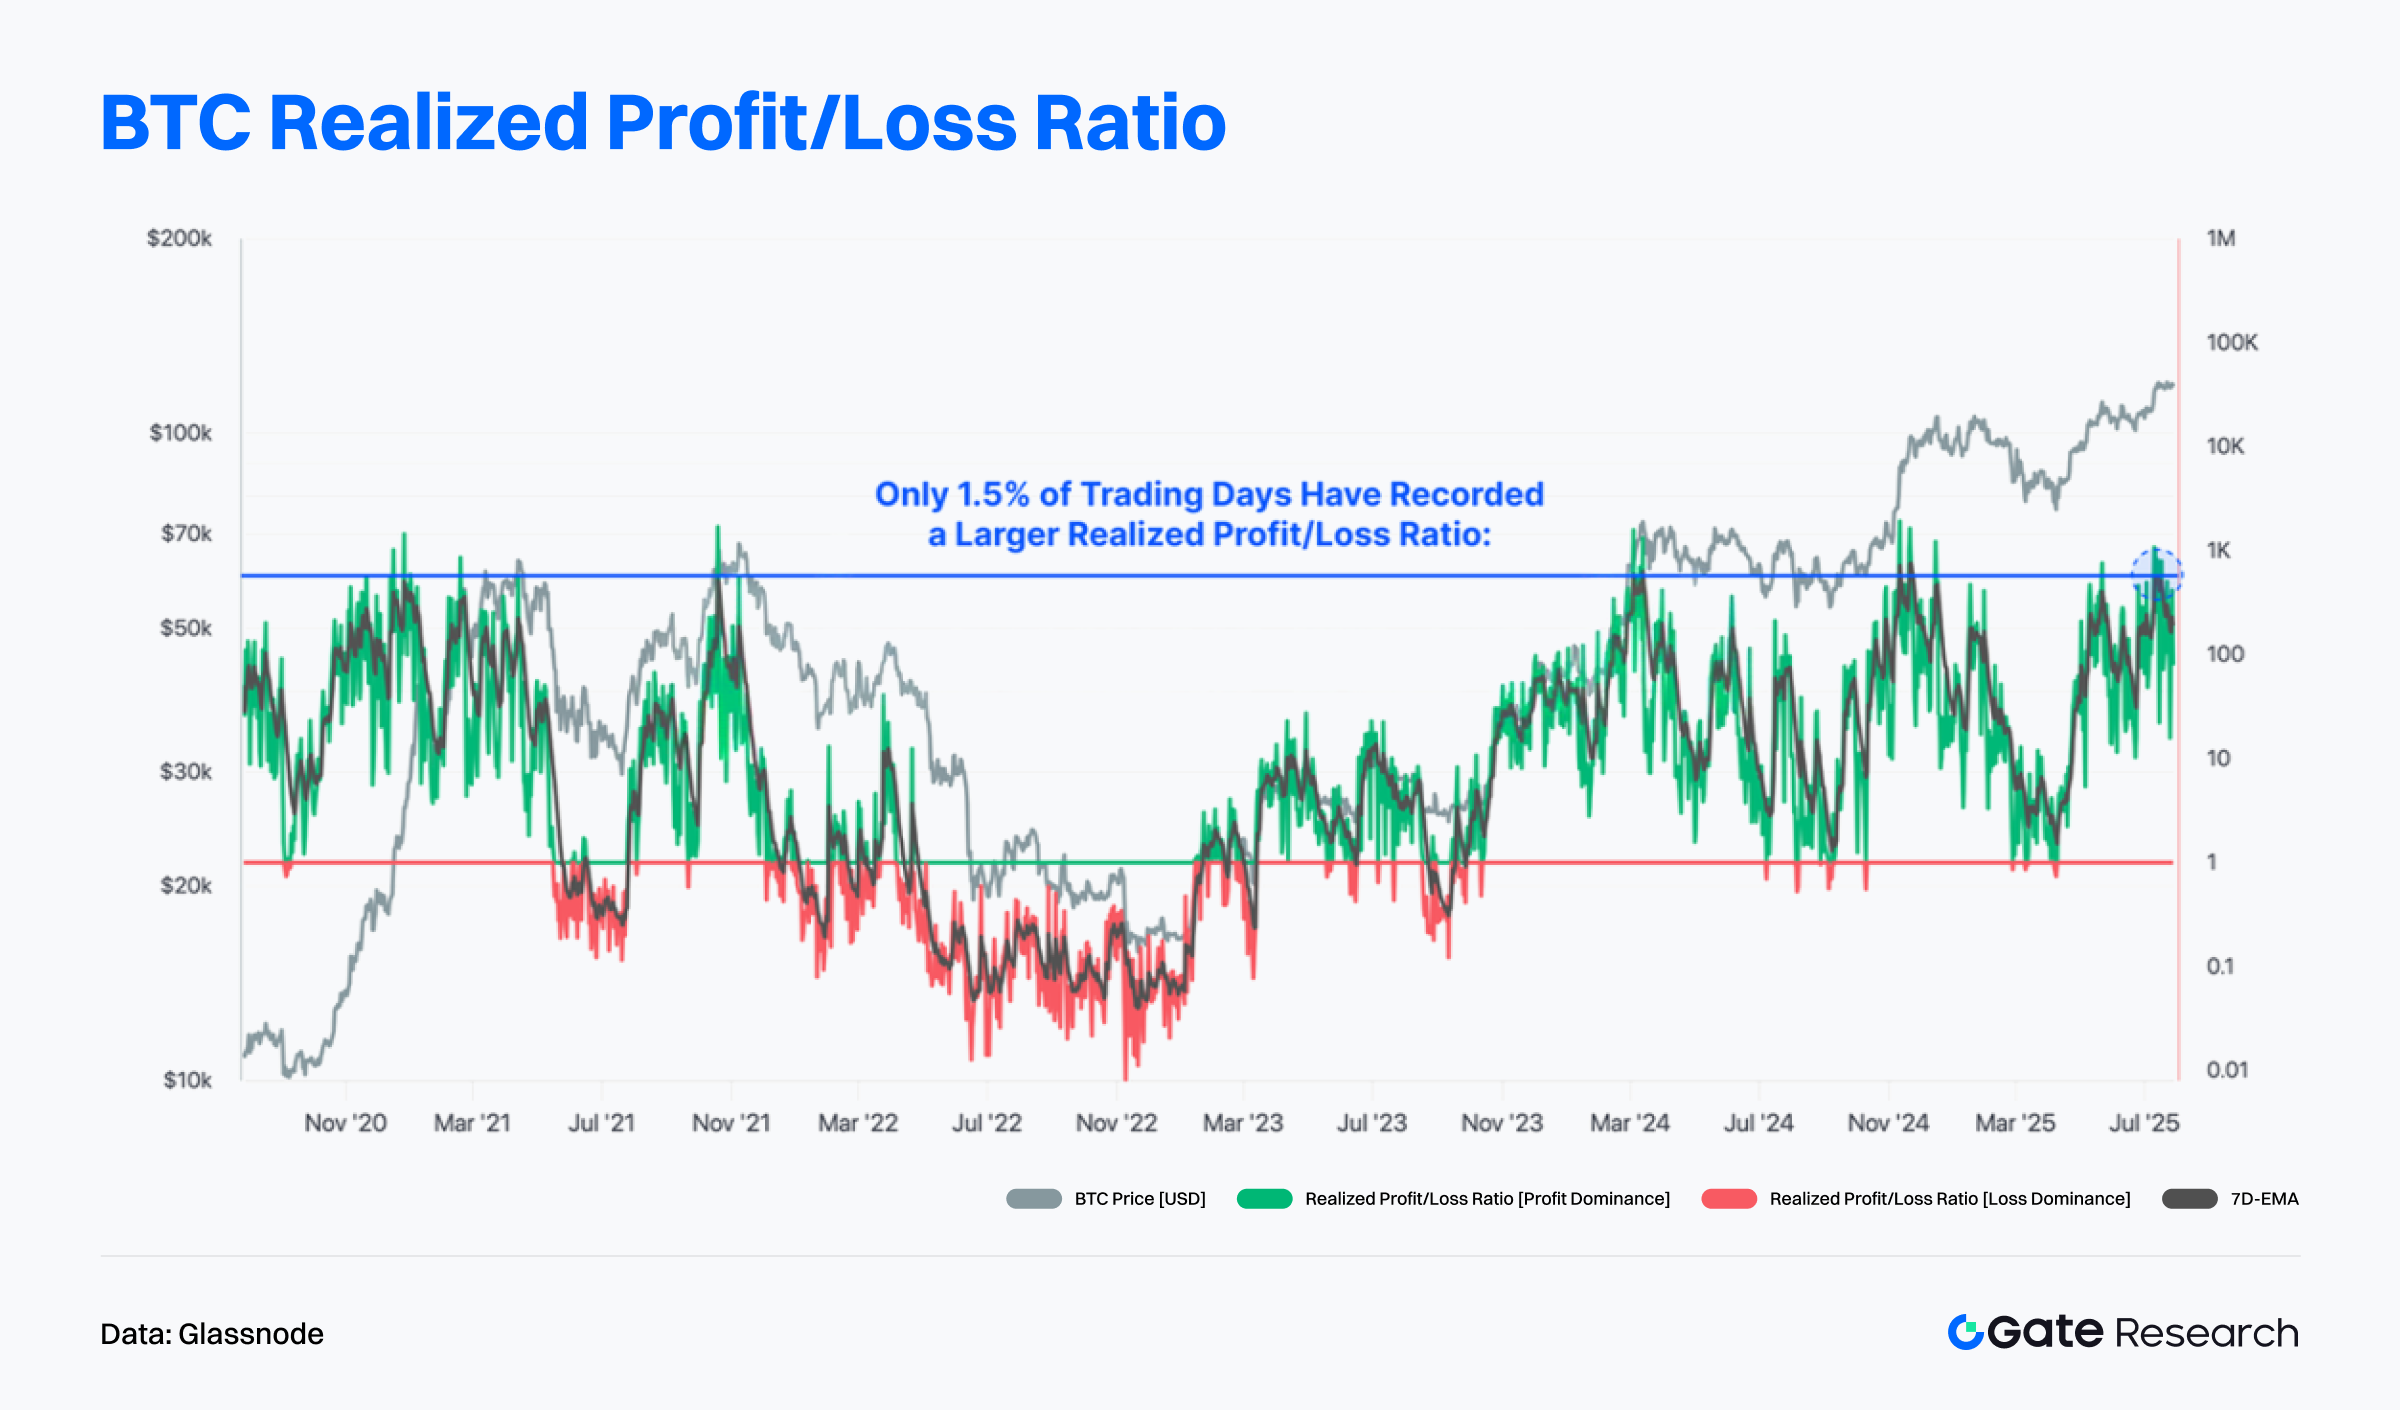
According to Glassnode, recent profit-taking activity has surged, pushing the Realized Profit/Loss Ratio to extreme highs. Currently, realized profits outpace realized losses by a ratio of 571:1, a historically rare occurrence seen in only about 1.5% of trading days. As shown in the chart, this ratio has approached its historical upper bound, coinciding with Bitcoin’s ongoing price consolidation at elevated levels.【8】
However, this doesn’t necessarily imply an imminent market top. Historically, strong profit realization has signaled a high-risk phase but does not always trigger immediate price corrections. For instance, during the March 2024 rally to $73,000, the ratio spiked alongside intense profit-taking, yet price continued higher. Similarly, in late 2024, when BTC broke through $100,000, the ratio peaked near $98,000, but the price went on to rise to $107,000 before topping out.
In summary, intense profit-taking generally signals elevated market risk, but price pullbacks tend to lag. In the short term, such activity increases supply pressure, requiring time for the market to absorb it before prices respond meaningfully.
BTC Long-Term Holder Supply Declines, Short-Term Supply Ratio Rises, Signaling Higher Volatility
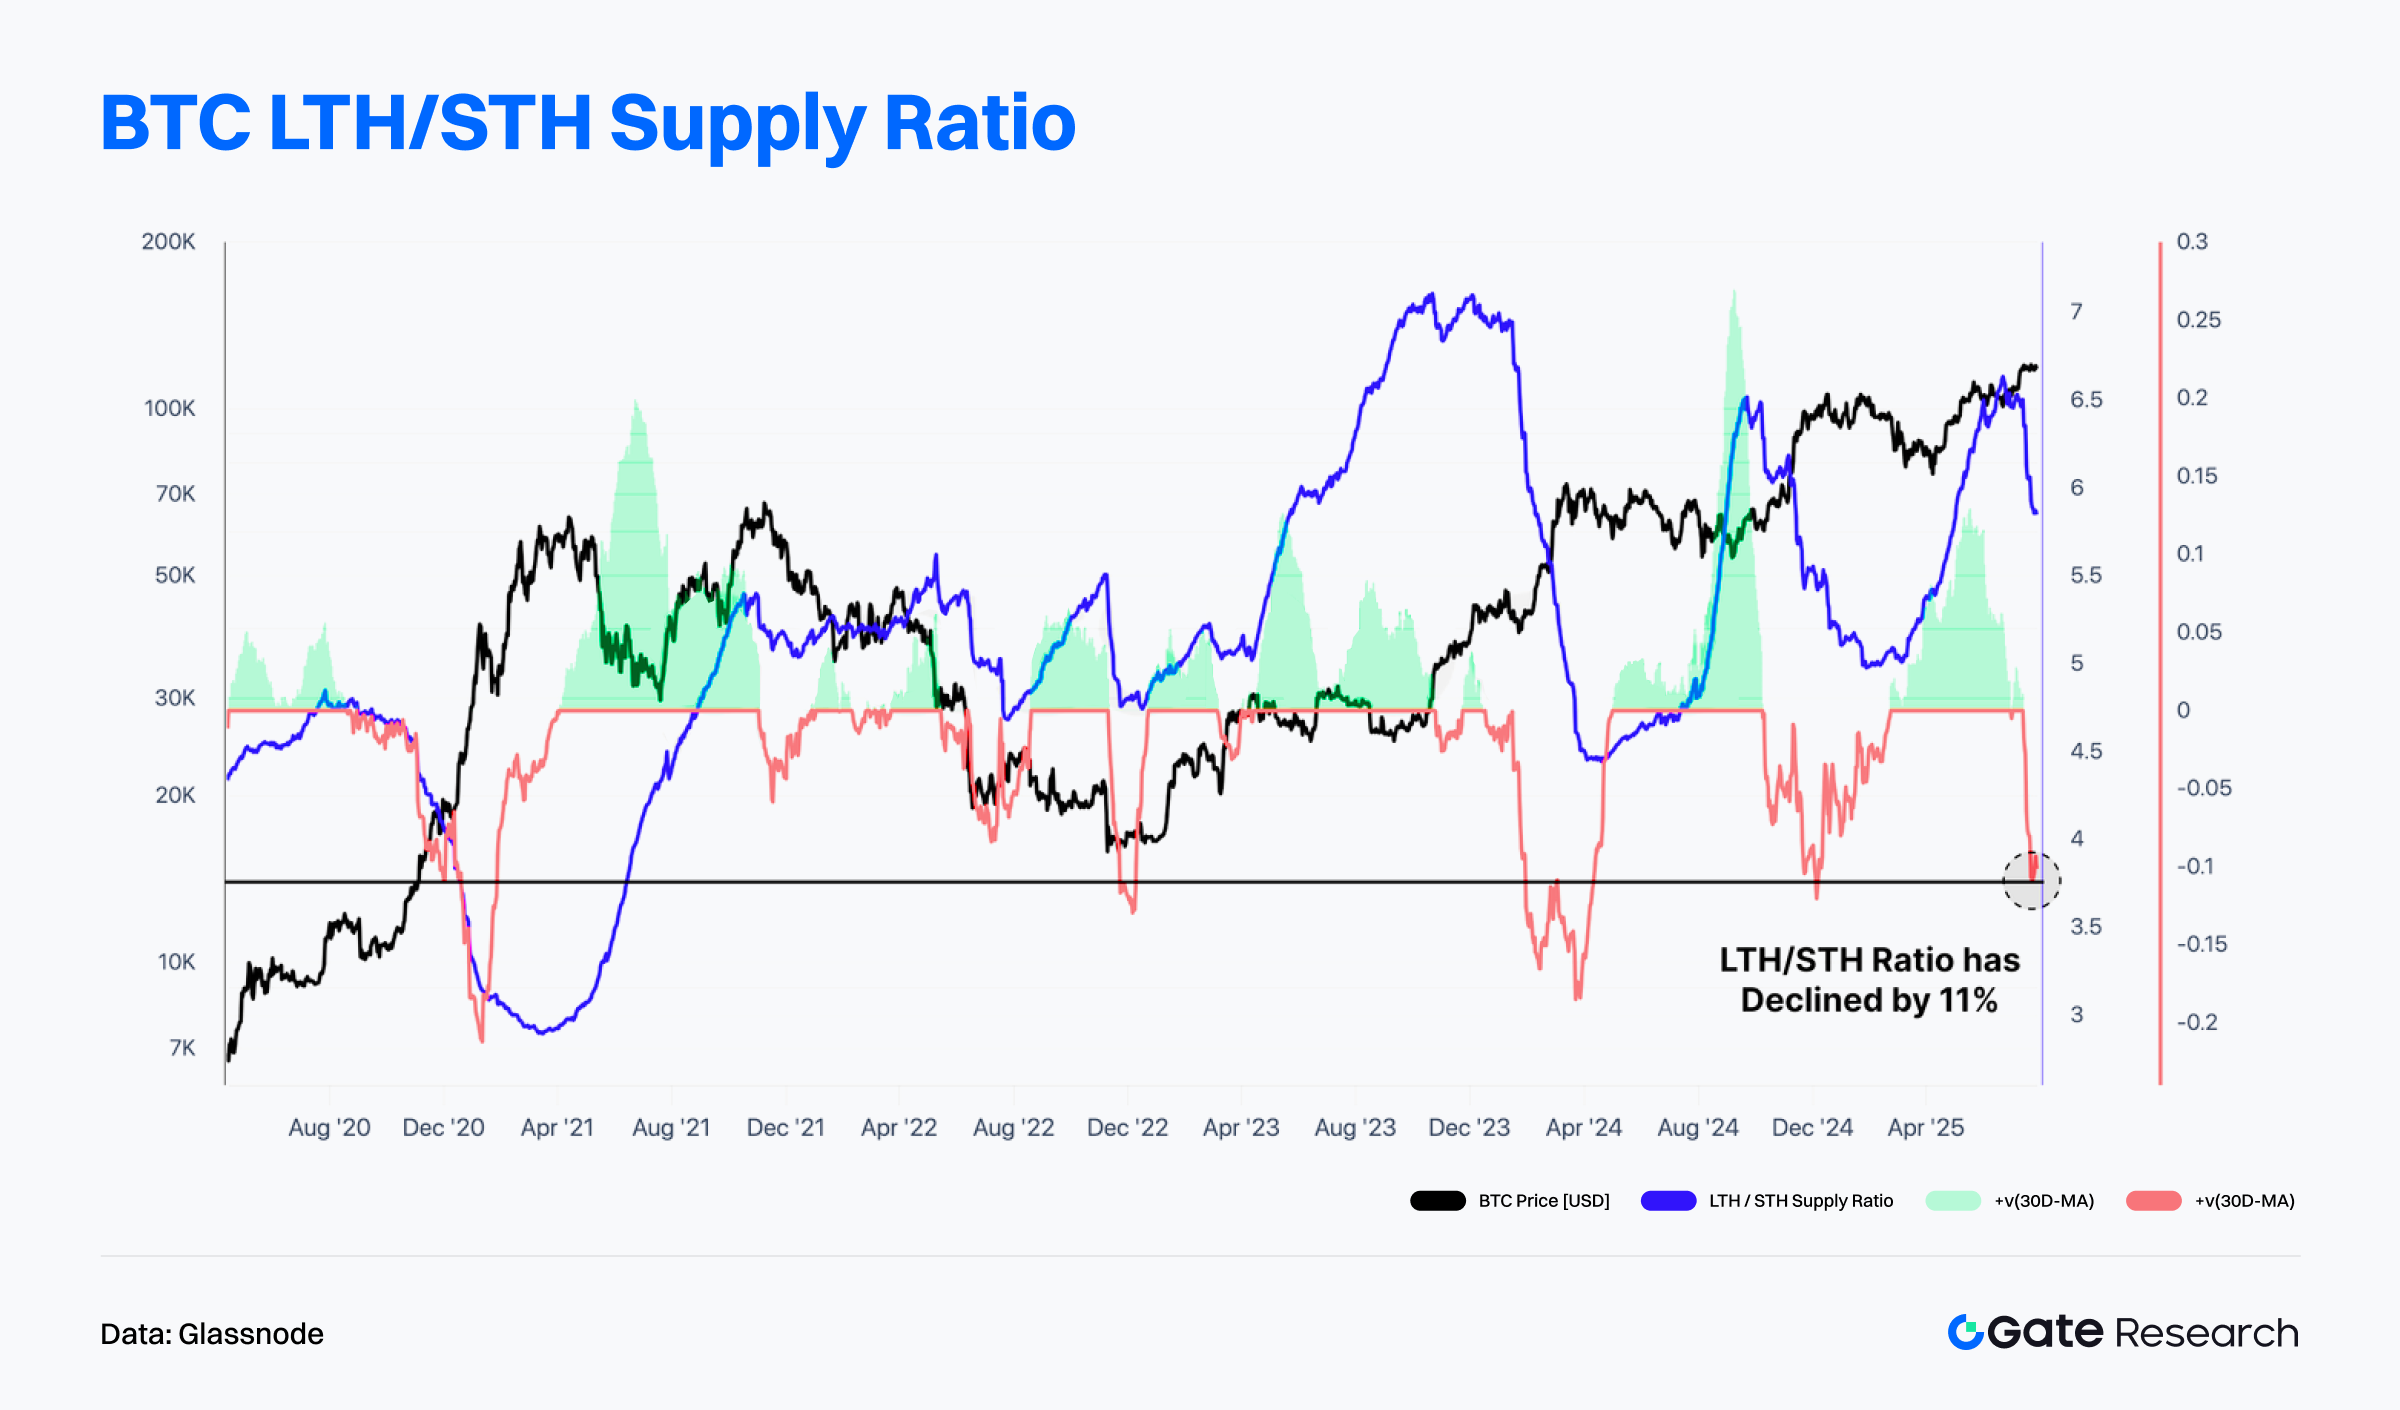
Glassnode data also shows a notable decline in the Long-Term Holder to Short-Term Holder Supply Ratio (LTH/STH), which has dropped about 11% from its peak. This shift reflects an increase in short-term-held supply—often a sign that some long-term investors are taking profits while newer participants buy in at elevated prices.
Such a structural change typically occurs during price surges or near local tops, indicating a rotation of holdings. This redistribution can lead to increased short-term market volatility, but also reflects heightened market activity.
【9】That said, the LTH/STH ratio remains at relatively high levels, suggesting that overall long-term conviction in the market remains intact and continues to offer support. If the ratio continues to decline, it could indicate broader long-term holder distribution and bring temporary price pressure. Conversely, if the ratio stabilizes or rebounds, it may signal renewed accumulation and help reinforce bullish structural support.
Trending Projects & Token Activity
On-chain data indicates that capital and users are increasingly concentrating in ecosystems with strong interaction infrastructure and deep application layers. Projects that combine narrative appeal with technological innovation are emerging as new focal points for investor attention. The following section will highlight recent high-performing projects and tokens, analyzing the underlying drivers and potential implications.
Overview of Popular Project Data
LetsBonk.fun
In July 2025, Pump.fun—long the dominant meme coin launch platform on Solana—was comprehensively overtaken by the emerging competitor LetsBonk.fun across multiple key metrics, sparking widespread discussion and attention.
Launched in April 2025, LetsBonk.fun is a joint initiative by the BONK meme community and decentralized exchange Raydium. It positions itself as an all-in-one platform for meme coin issuance, combining token creation tools, creator incentives, and community-driven dynamics. The platform aims to offer low-barrier, high-efficiency solutions for token launches and liquidity provisioning.
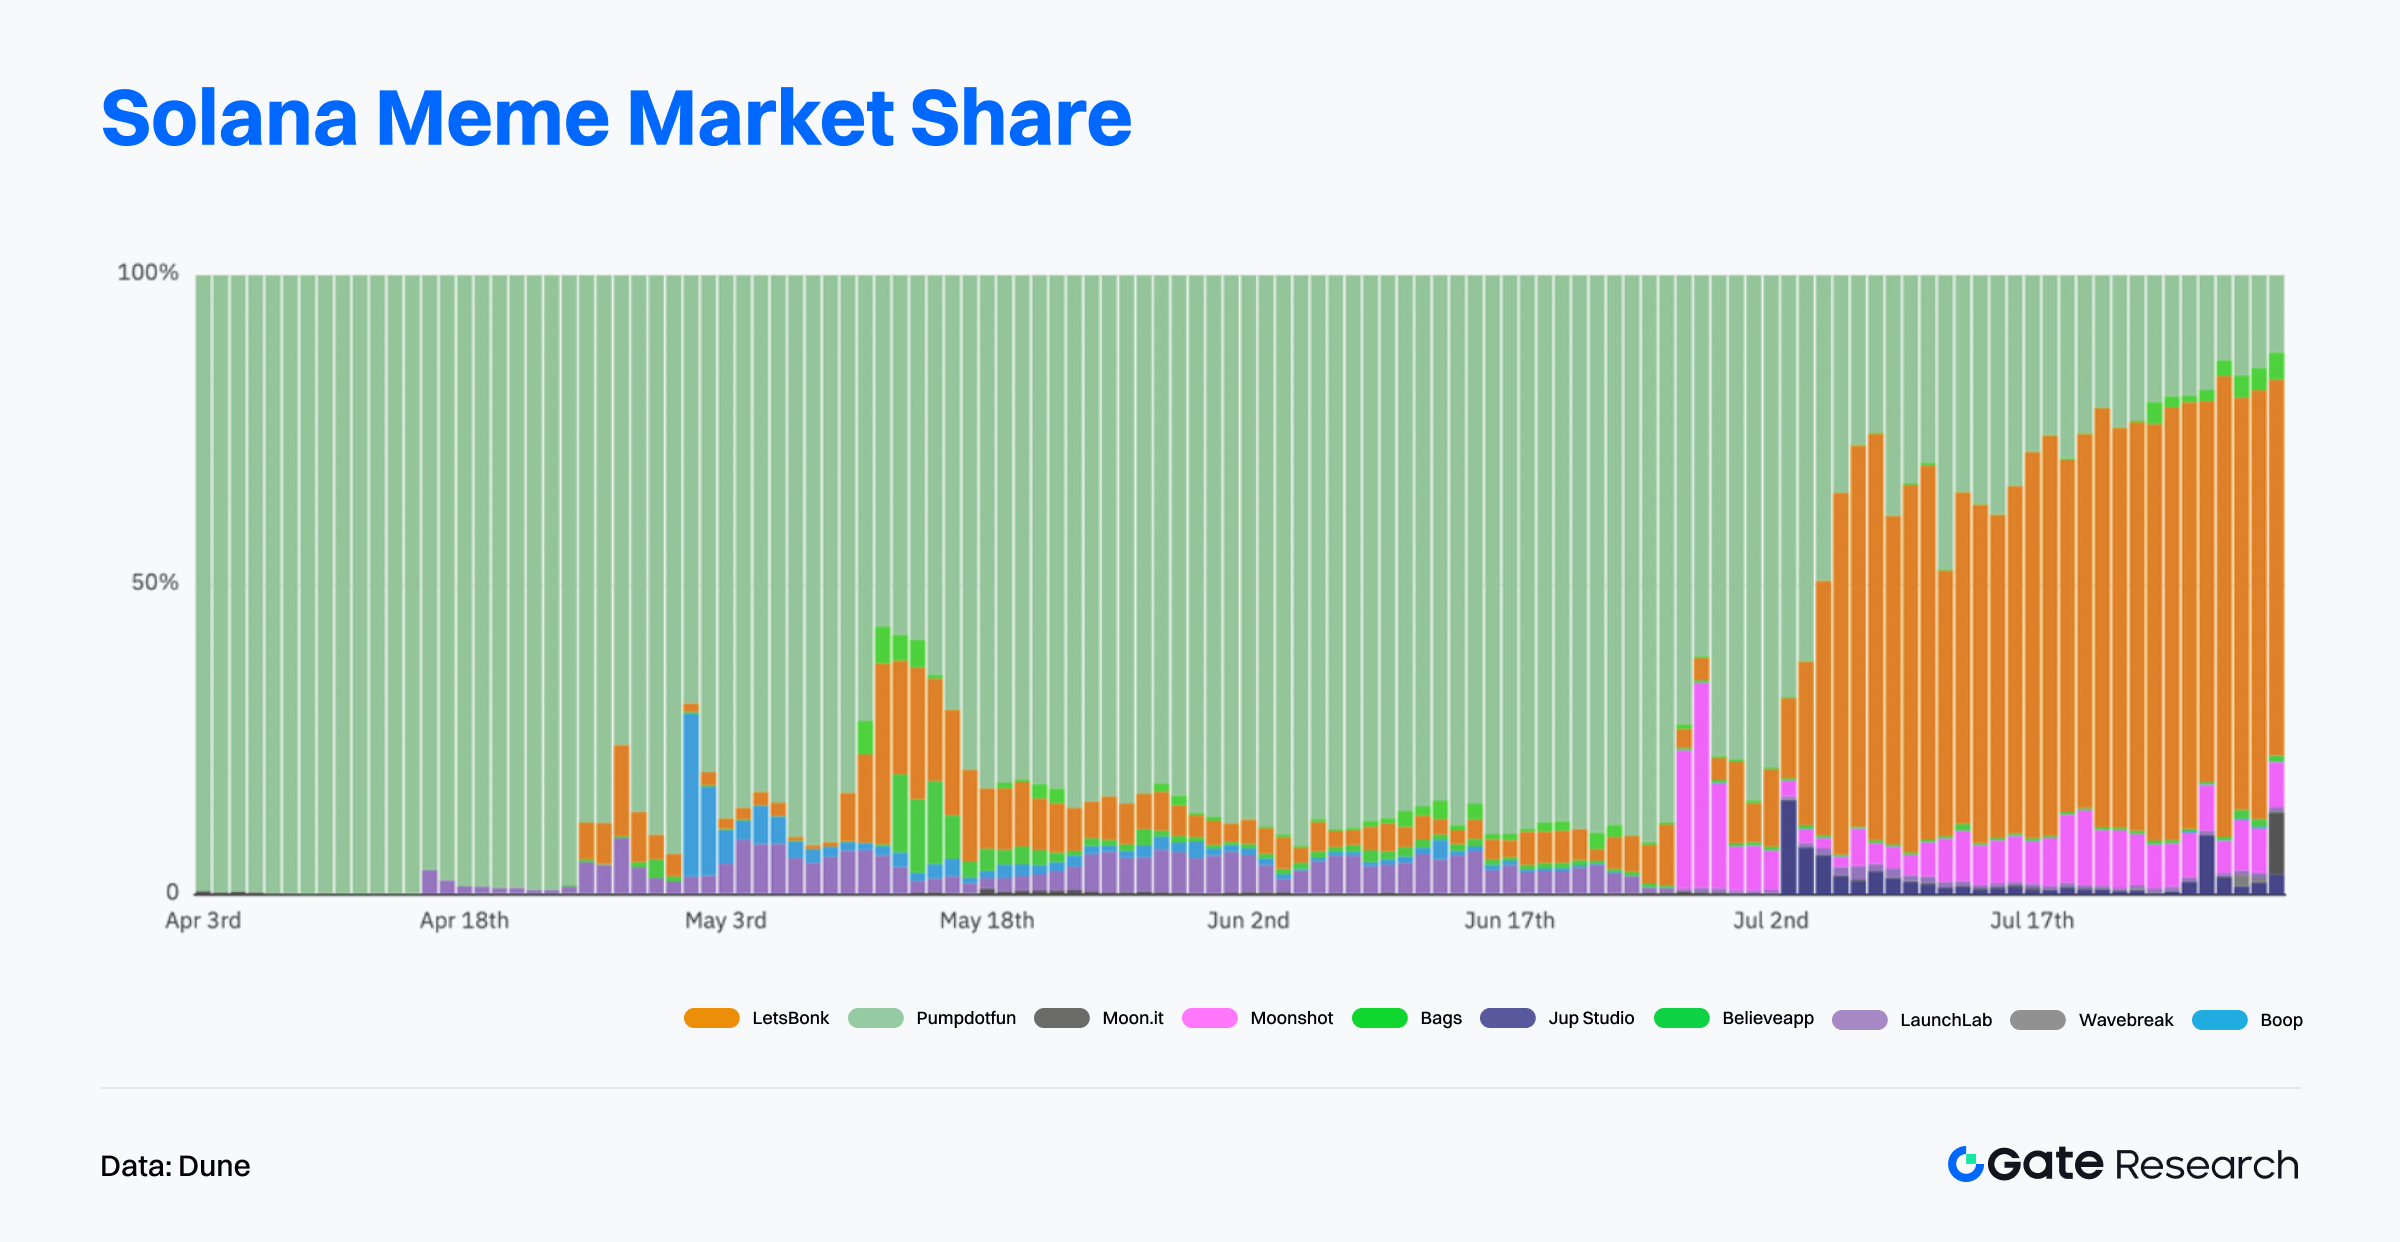
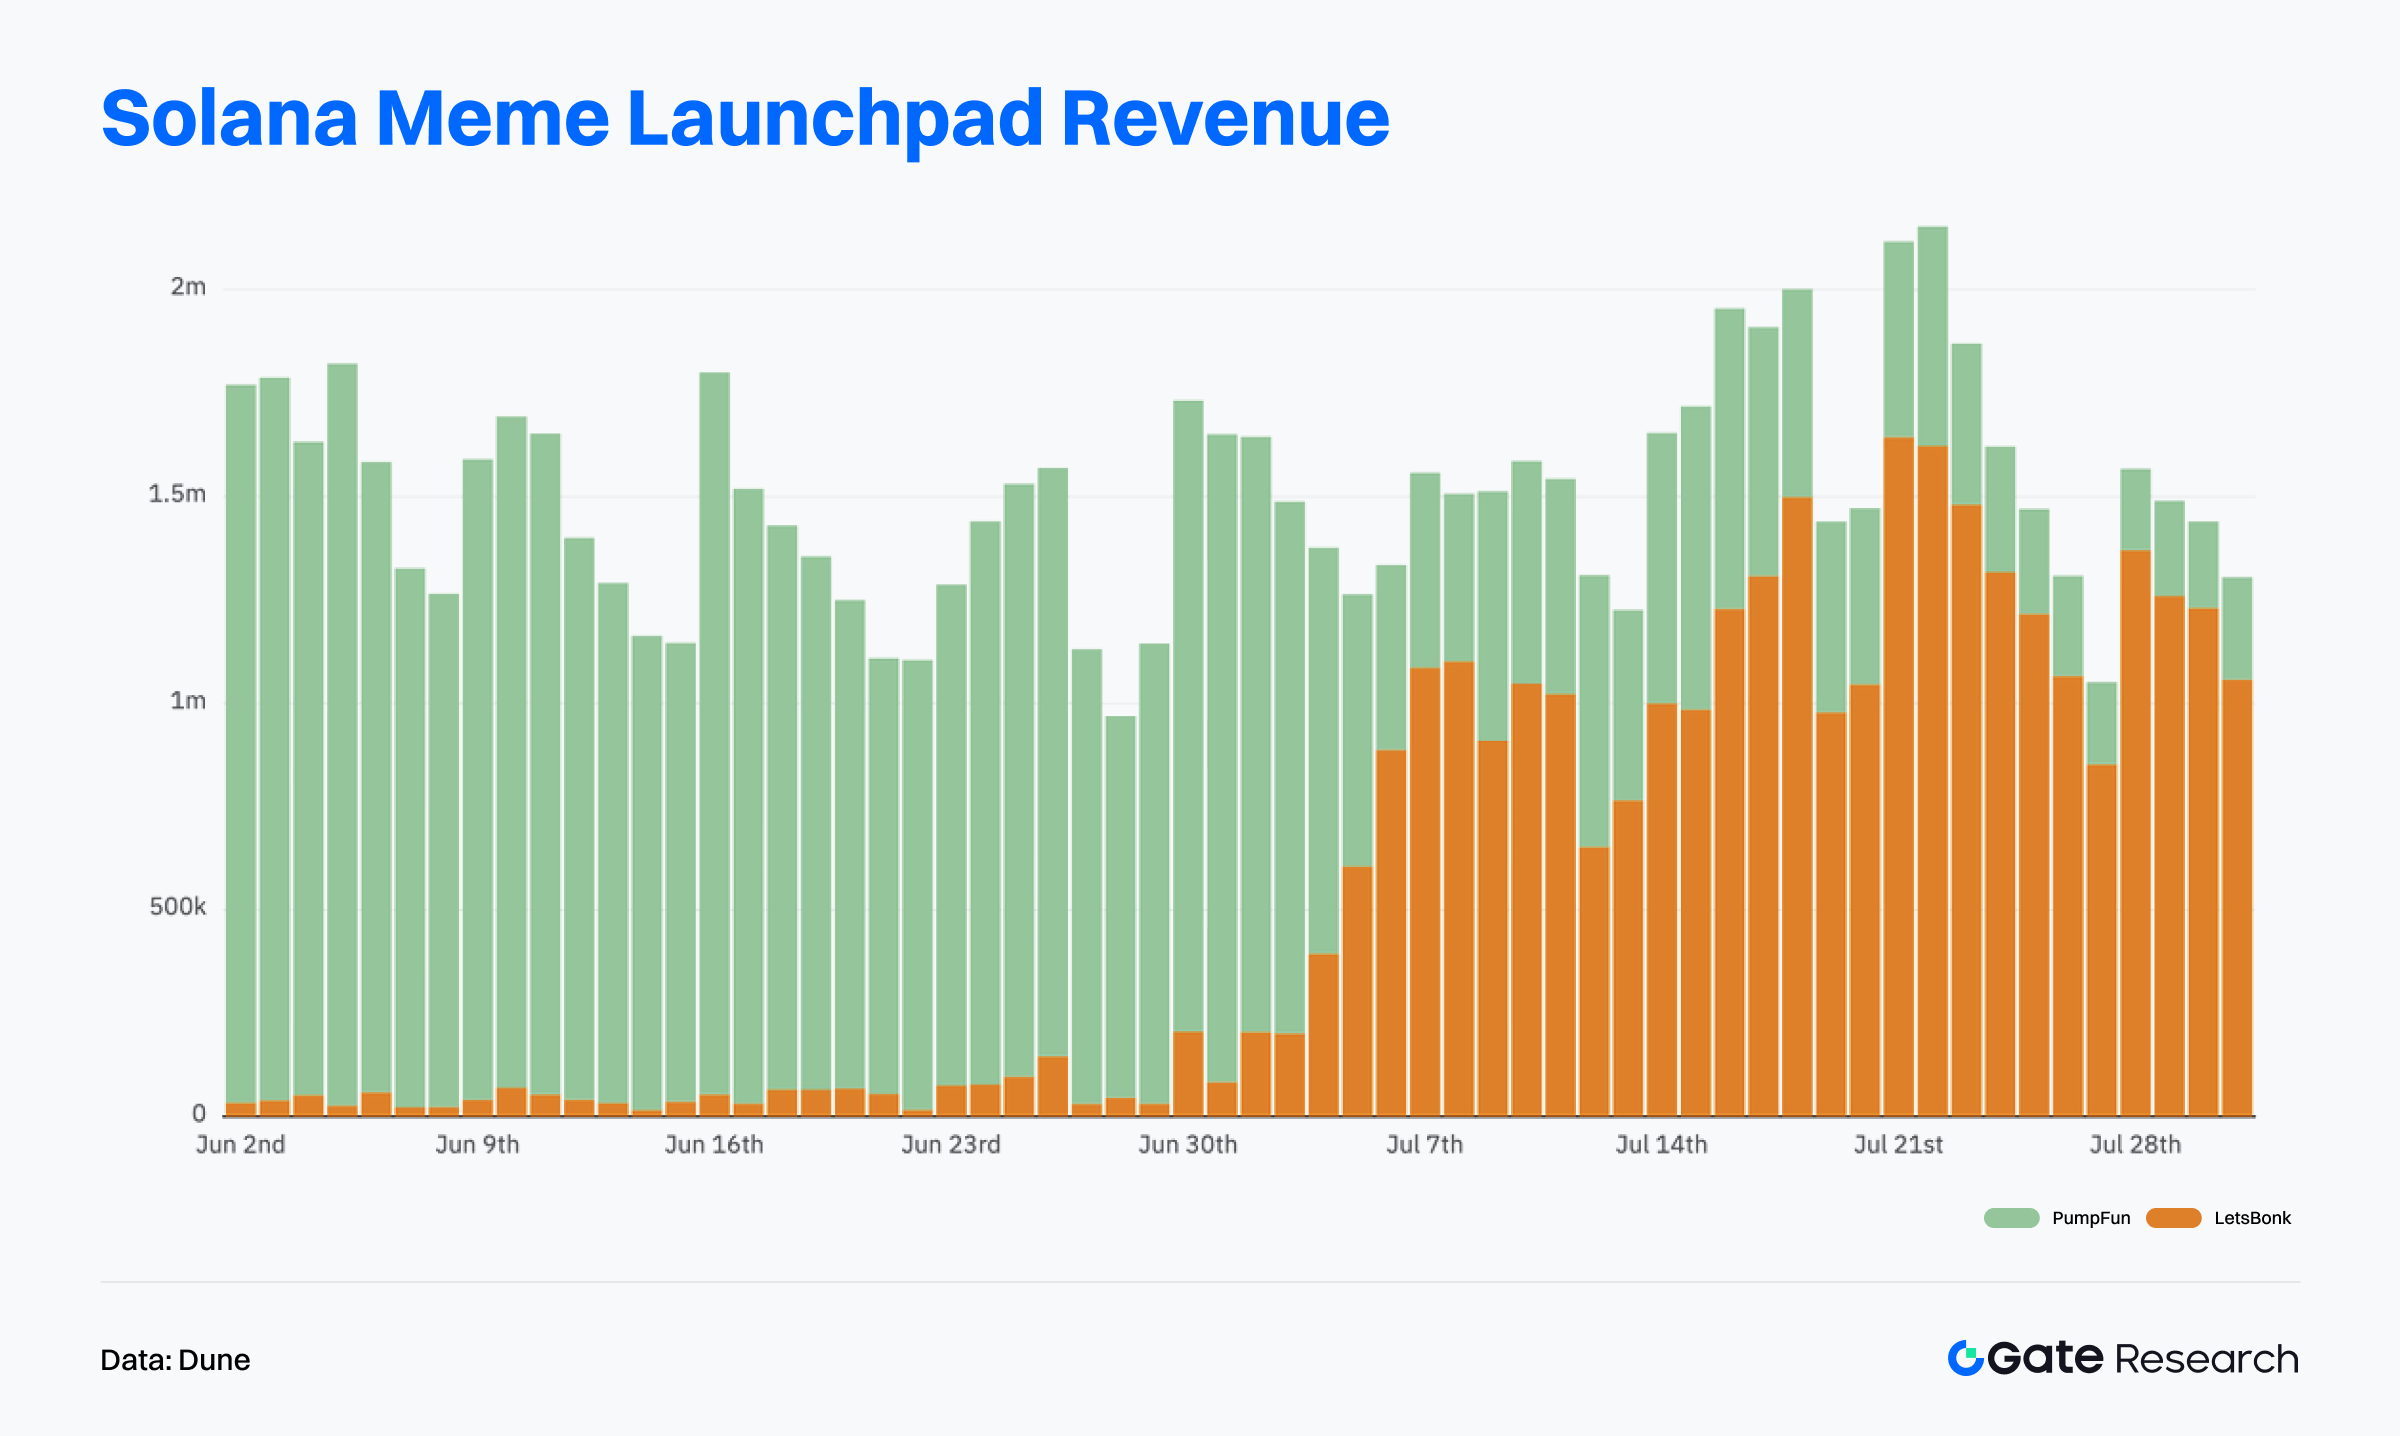
According to Dune data, Pump.fun nearly monopolized the meme coin market between April and June, once capturing up to 95% market share. However, from July onward, LetsBonk.fun rapidly gained momentum in token issuance and surpassed Pump.fun by mid-month, maintaining over 50% share, thereby establishing itself as the leading platform in the new market cycle. This shift marks a transition from a single-platform monopoly to a multi-platform competitive dynamic in the meme coin space.【10】
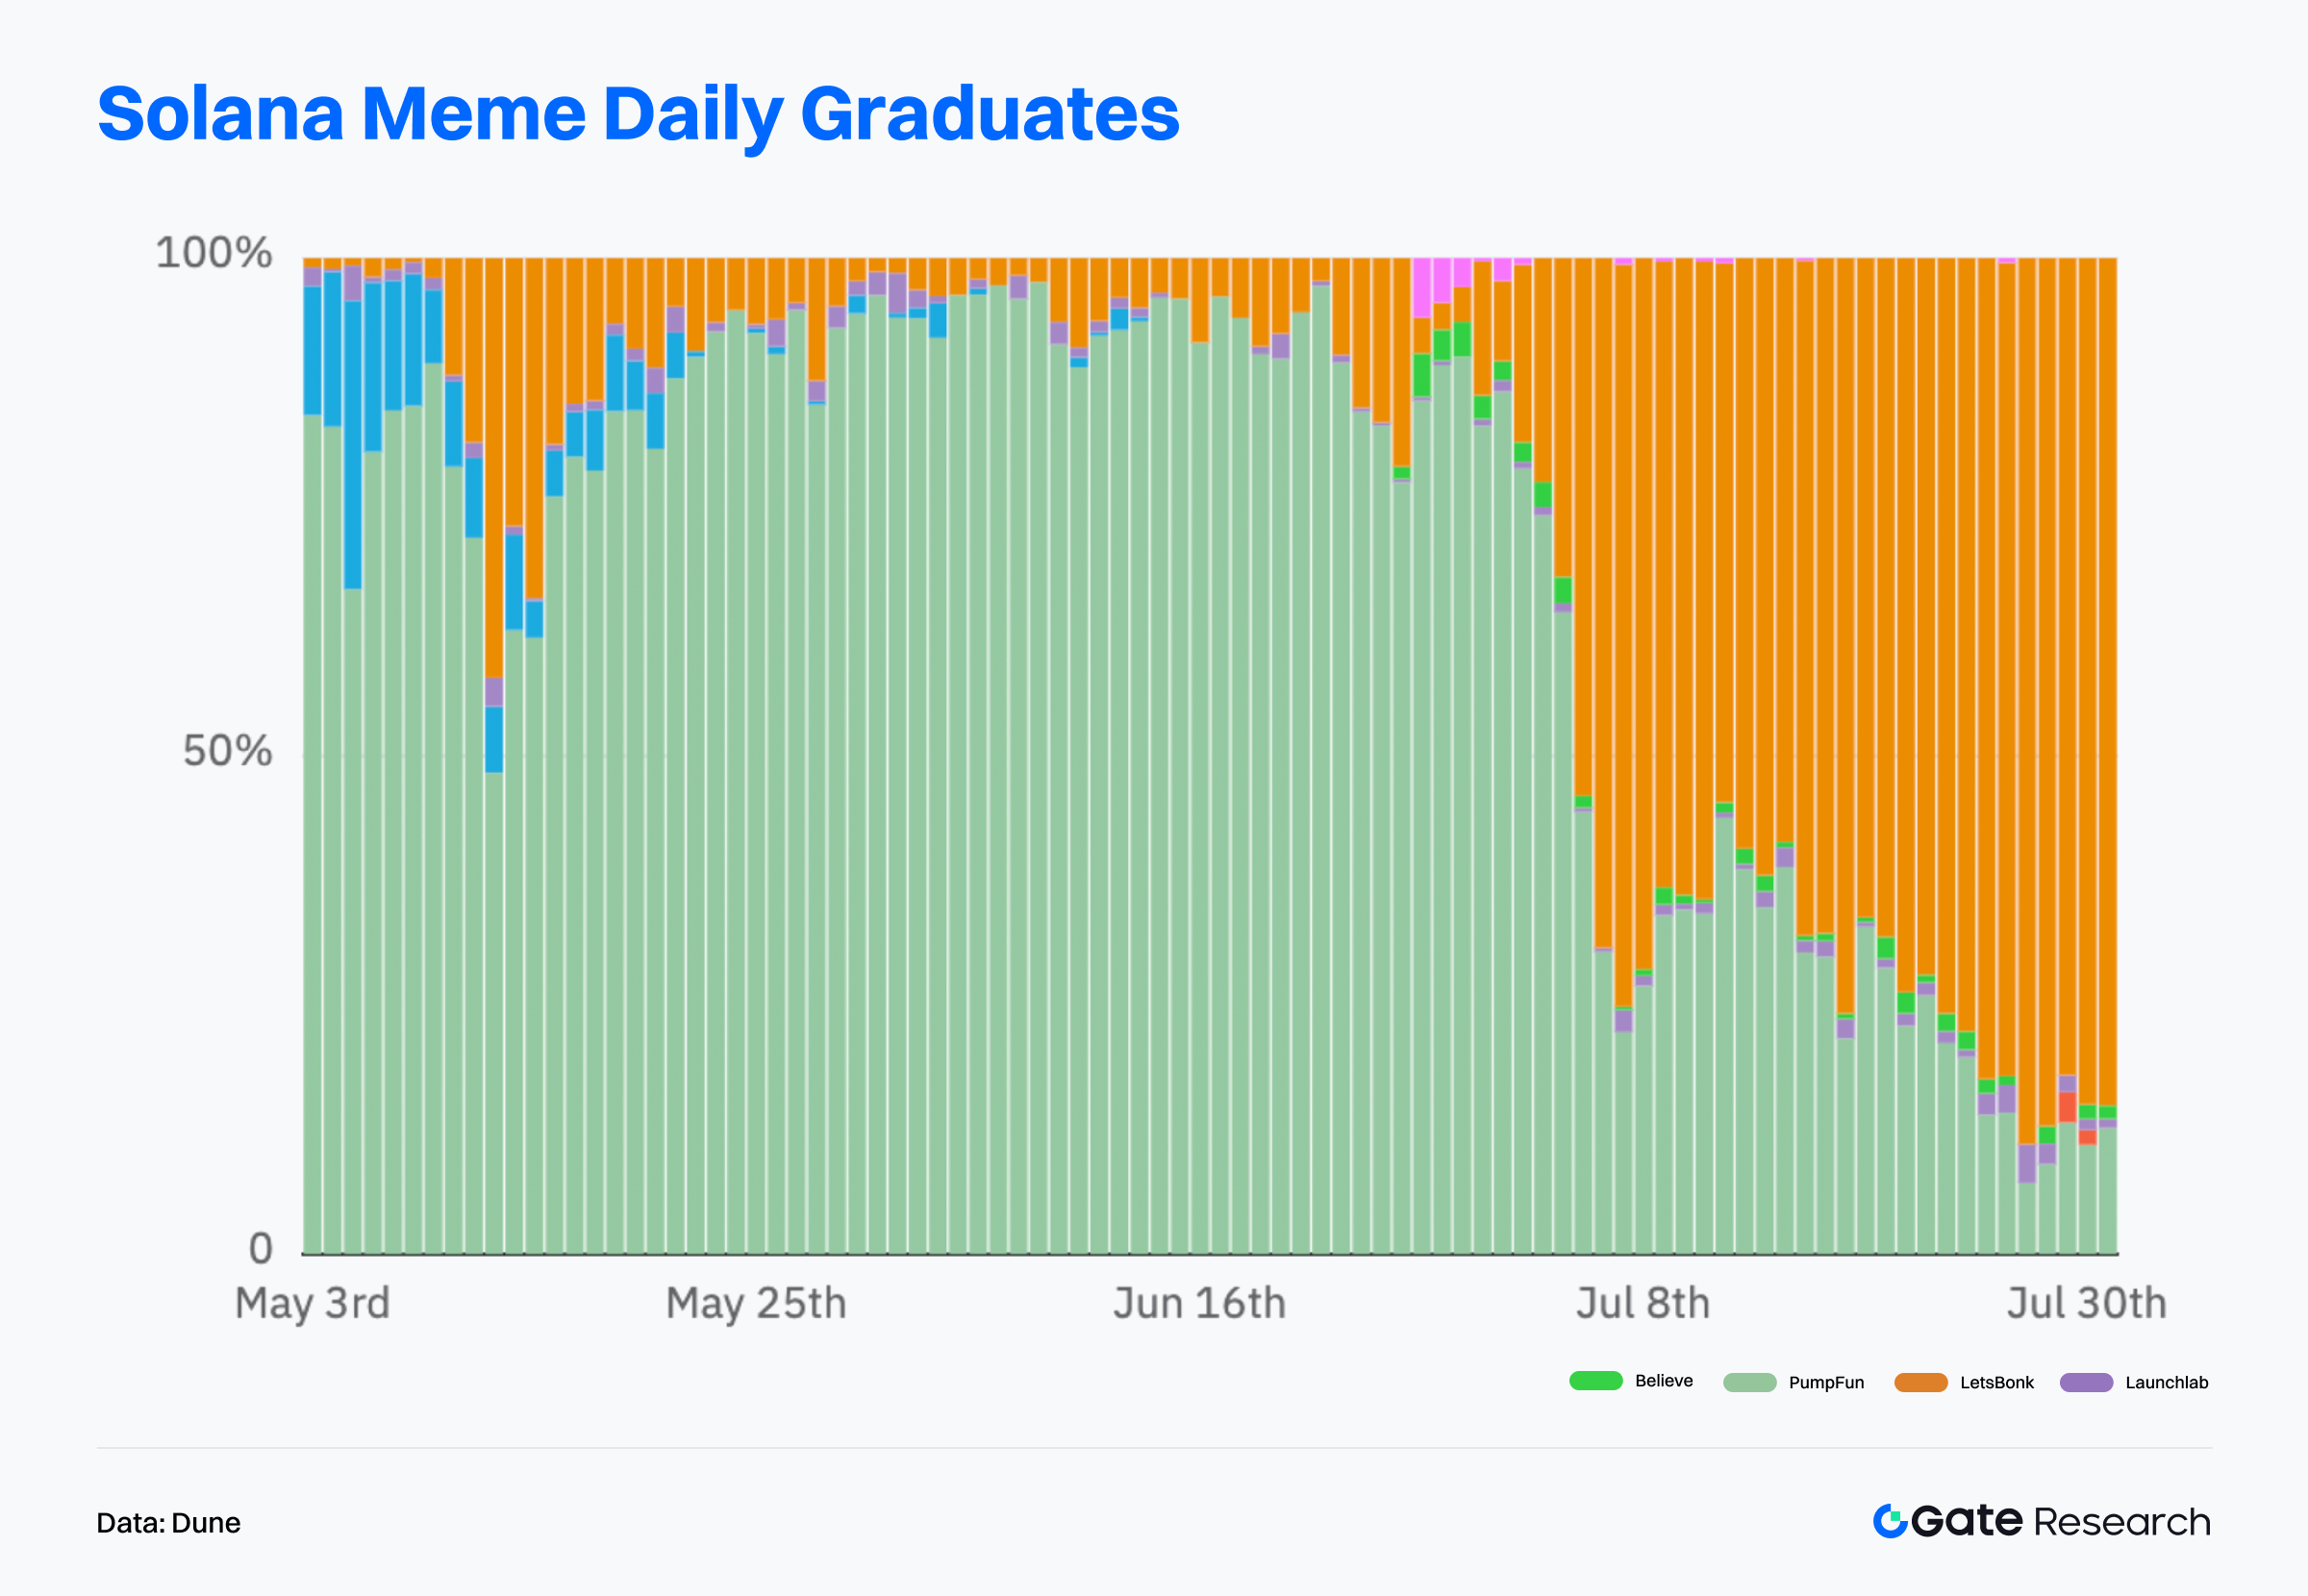
Daily Graduated Token Count
Since July 8, LetsBonk.fun has consistently outpaced Pump.fun, holding 70–90% of daily graduated token volume—indicating superior liquidity support and market recognition.
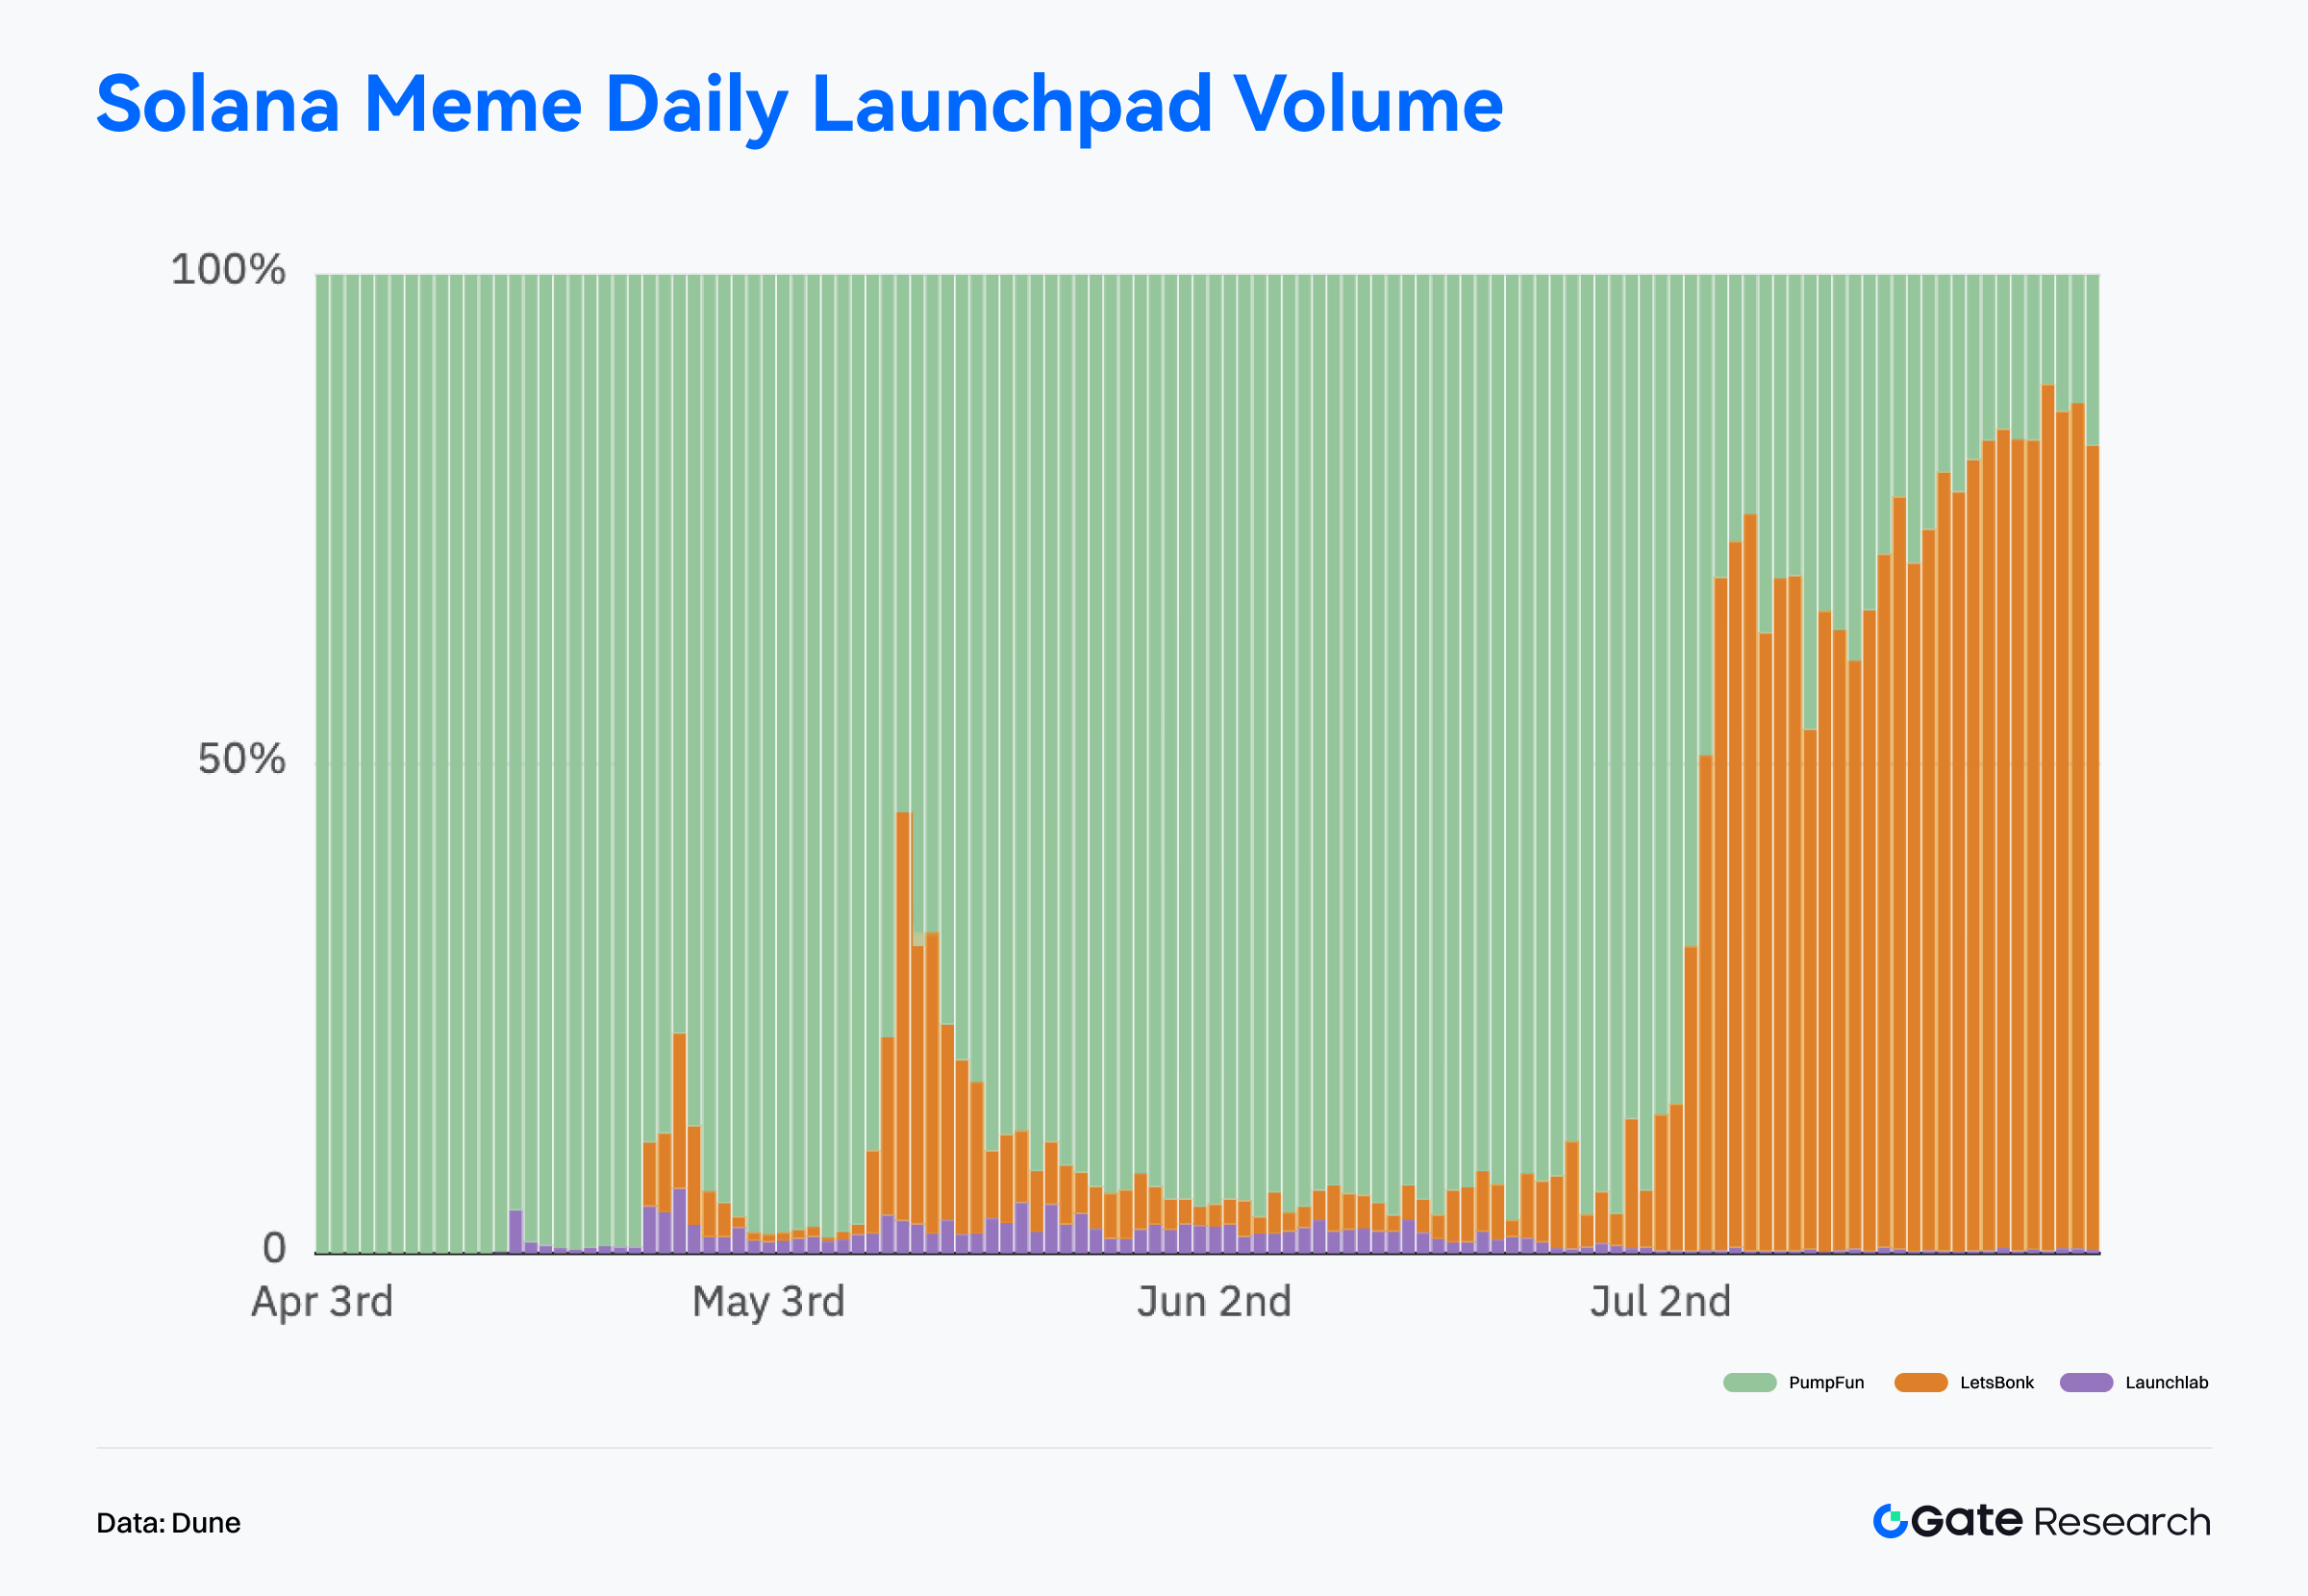
Daily Trading Volume
Within just two weeks, LetsBonk.fun surpassed its rival, with market share stabilizing at 60–80% after mid-July, reflecting strong organic trading momentum from real users.
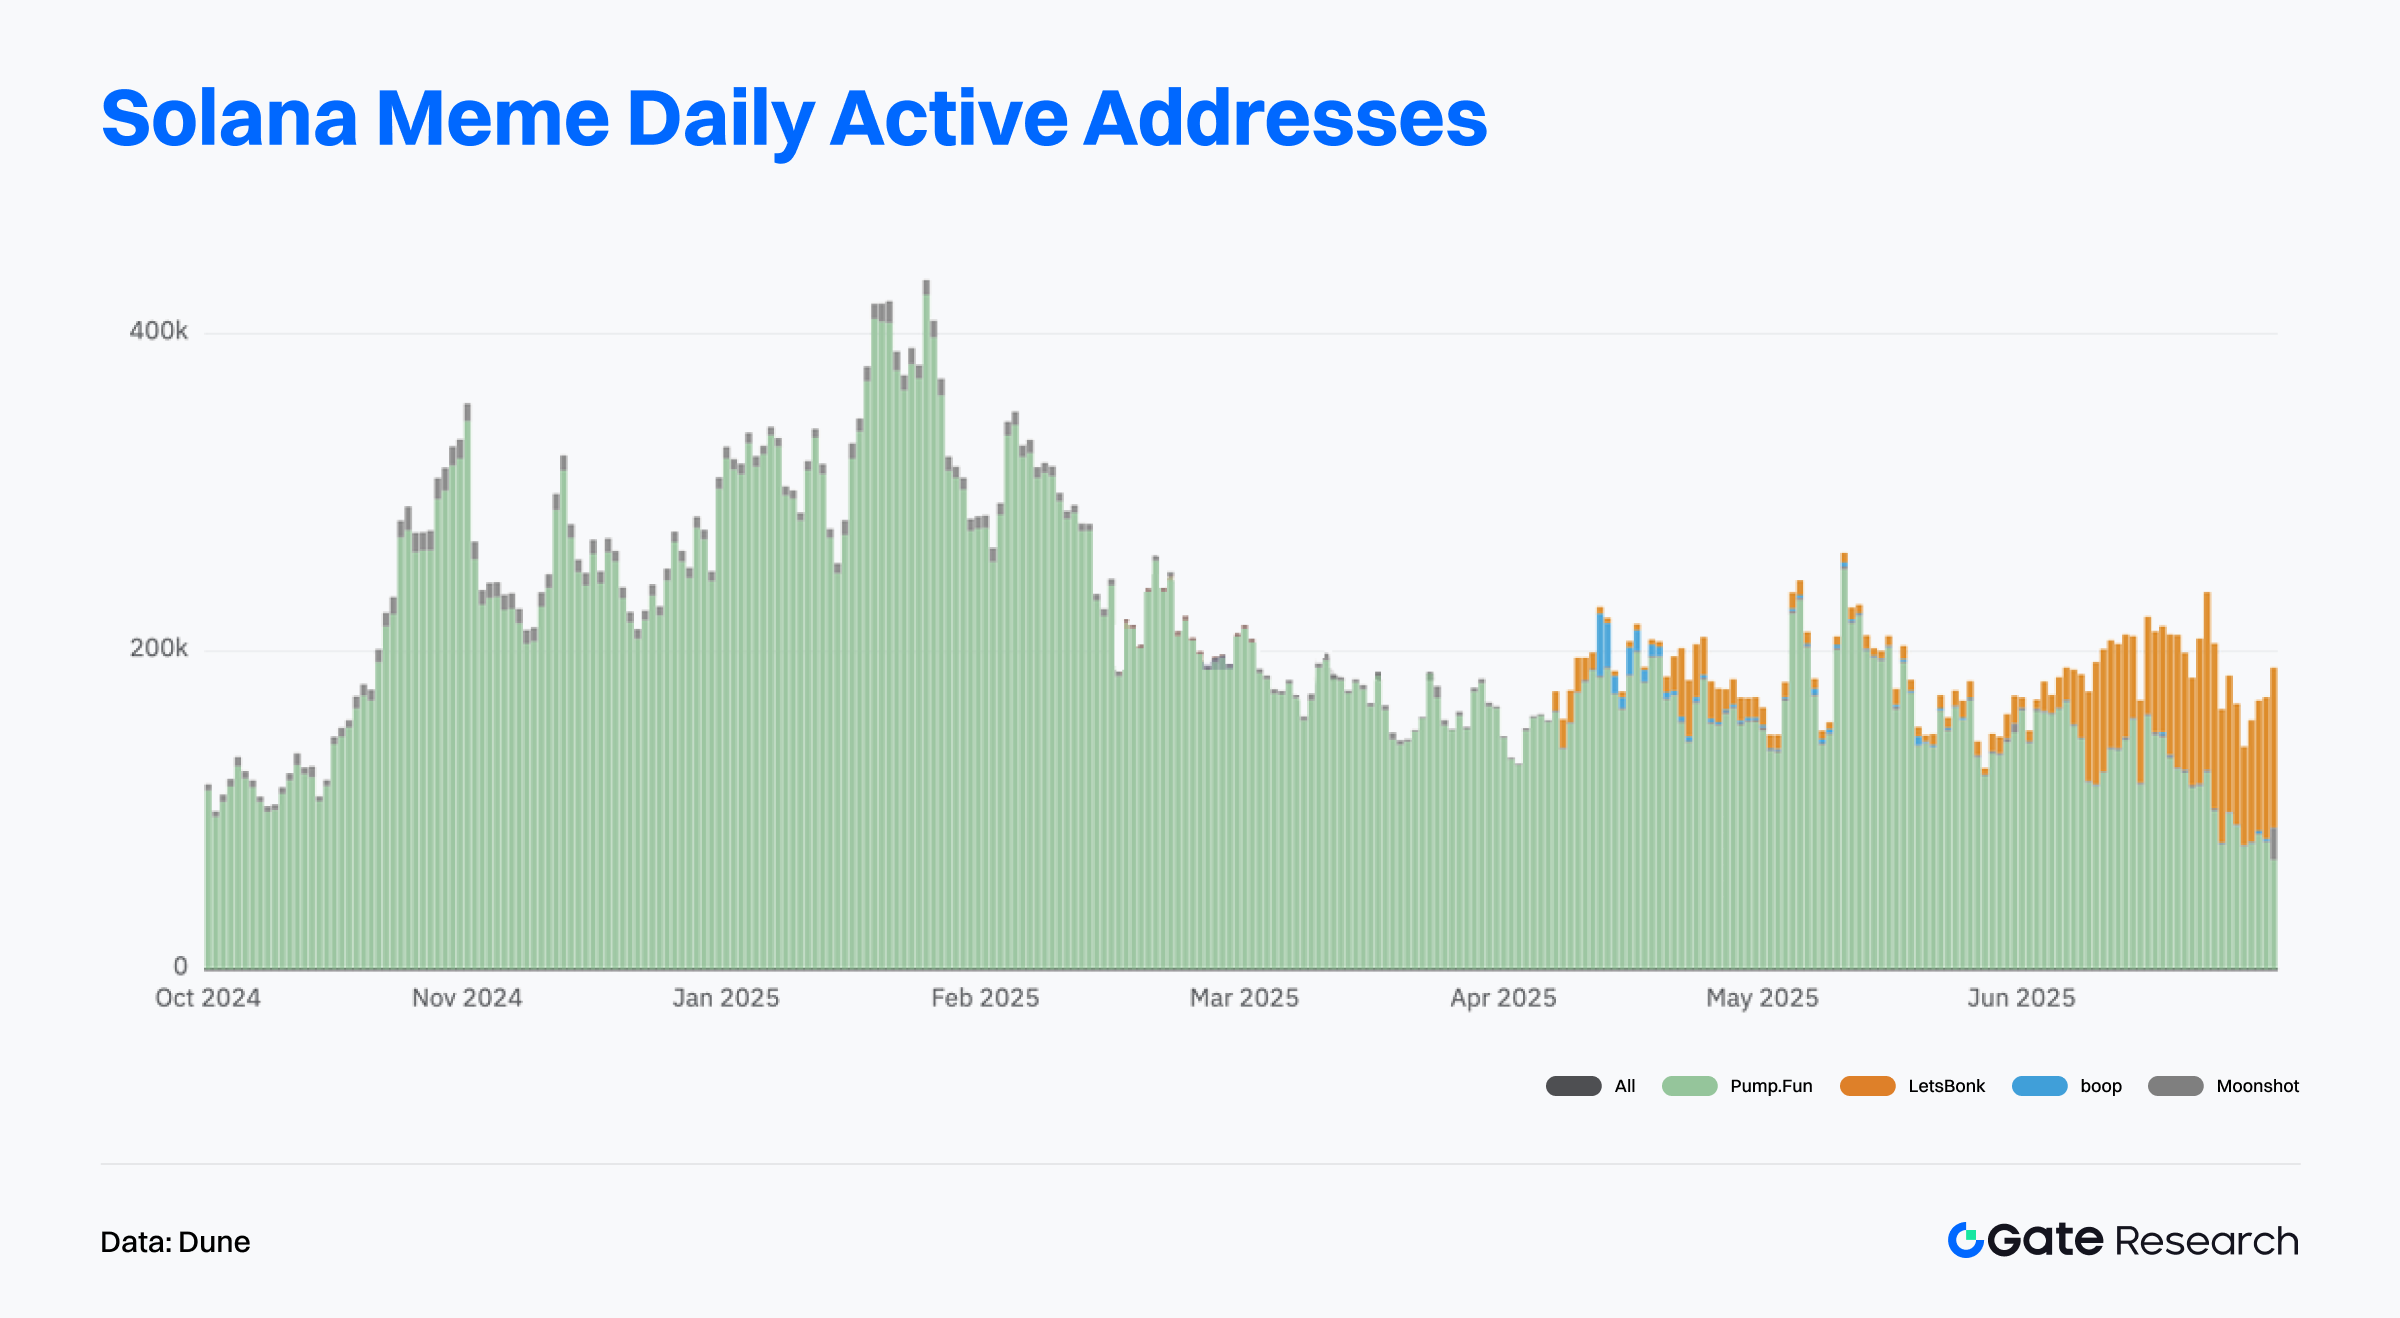
User Structure
While Pump.fun once peaked at 400,000 daily active addresses, its usage has declined since Q2. Conversely, LetsBonk.fun has seen steady DAU growth since late June, suggesting a user migration not just in traffic but in depth of interaction.
Launchpad Revenue
Pump.fun maintained the lead through June, but from late June onward, LetsBonk.fun’s revenue surged and overtook Pump.fun for the first time on July 6. Between July 18–24, daily revenue repeatedly exceeded $1.5 million, securing its position as the highest-earning platform in the sector.
Total Market Cap of Tokens Launched via LetsBonk.fun
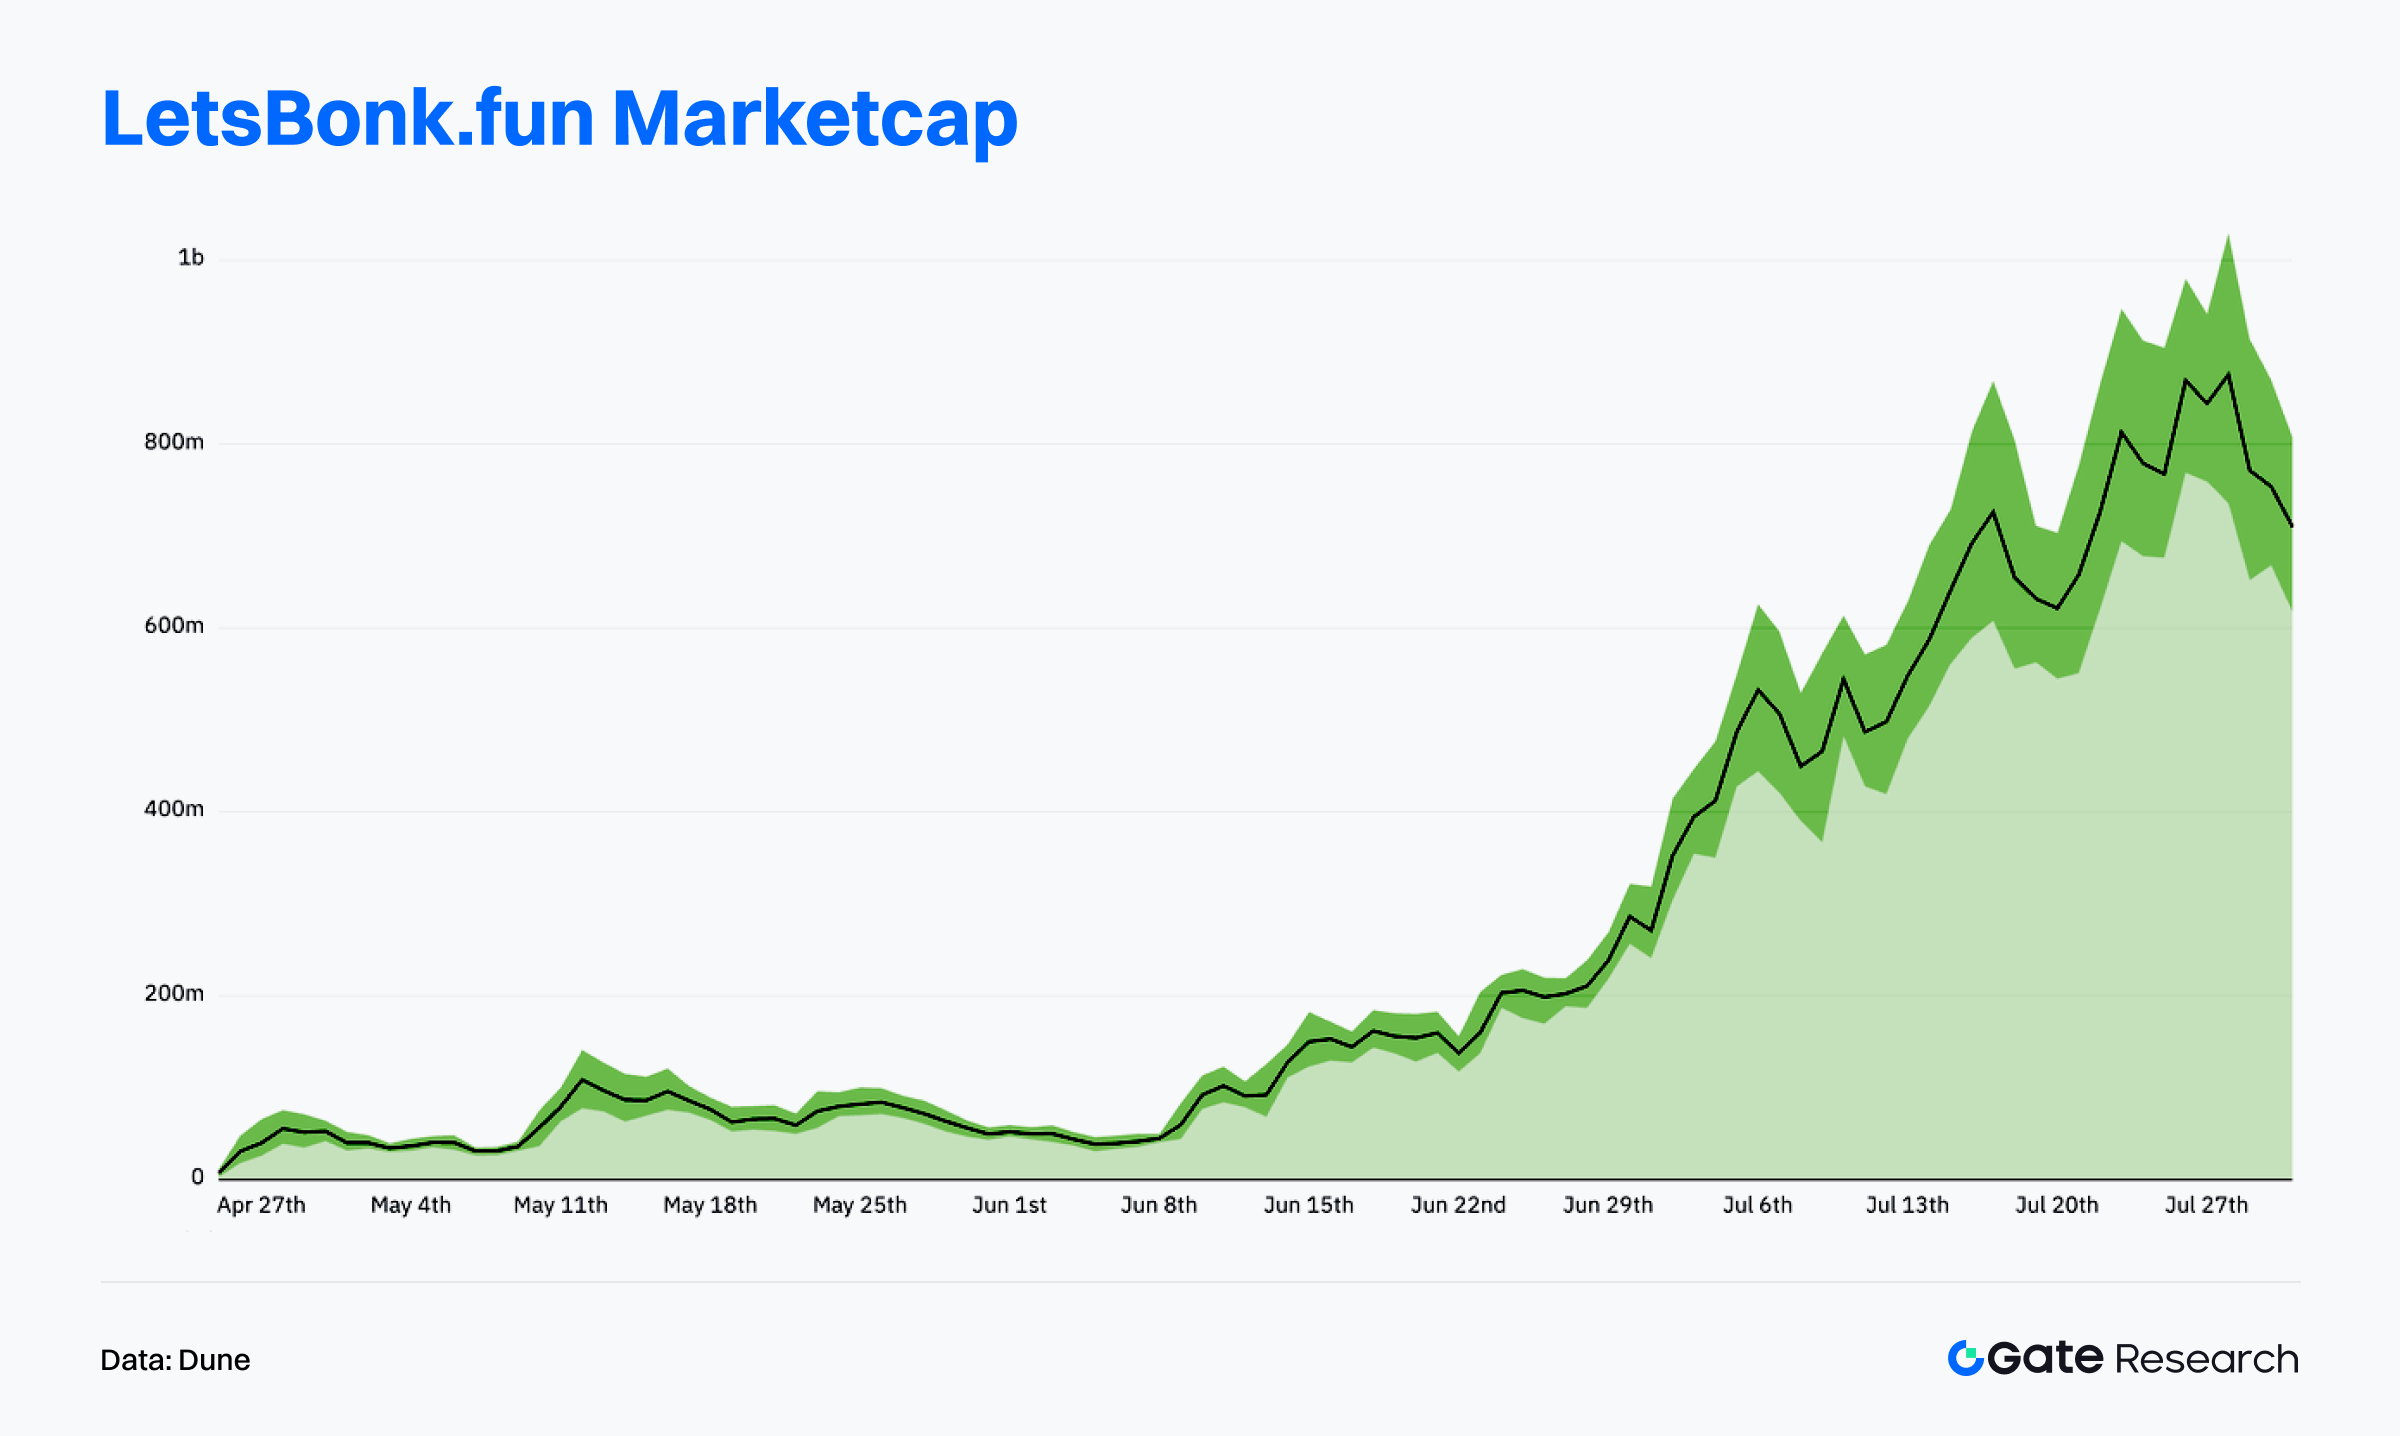
As of July 31, the cumulative market cap of tokens launched via LetsBonk.fun surpassed $700 million, skyrocketing from less than $100 million in early May. It nearly hit $1 billion at its peak—far outpacing other launchpad platforms.【11】
The explosive growth was largely driven by USELESS, a flagship meme token whose market cap surpassed $250 million, accounting for over a third of the BONK ecosystem. Since June, the token has surged more than 20x, sparking strong FOMO and imitation across the platform. With nearly 30,000 holders and an average wallet size of over $9,000, USELESS shows high capital concentration and strong community loyalty. Despite temporary fluctuations in holder count alongside price changes, the overall trend remains upward, reflecting a solid base of loyal users.
According to Onchain Lens, USELESS once hit a market cap high of over $400 million. Crypto influencer Unipcs (@theunipcs) purchased 28.08 million USELESS tokens for around $360,000, which ballooned to a $9.4 million paper gain at the peak—becoming a sensational case of meme coin wealth creation.【13】This kind of emotional and demonstrative effect not only positioned USELESS as the platform’s flagship, but also amplified LetsBonk.fun’s capital inflows, project imitation trends, and content virality.
Moreover, LetsBonk.fun has outshined its peers in fee distribution and operational transparency. The platform charges a flat 1% fee per transaction, transparently allocating: 50% to BONK token buyback and burn, 15% to BONKsol staking, the rest to ecosystem development, GP reserves, and marketing. All fund flows are published in real-time via a public dashboard, enhancing community trust and participation.【14】
In contrast, Pump.fun has faced community scrutiny on this front. A report by Dumpster DAO on July 29 pointed out that while Pump.fun claimed to allocate 100% of daily revenue to platform token buybacks starting in July, on-chain data showed that while funds reached contract addresses, they were neither burned nor transferred, and no public dashboard existed to verify the process. This lack of transparency raised doubts about the authenticity of the buyback mechanism and was seen as a contributing factor to its declining market share.
Backed by breakout projects, user migration, transparent revenue redistribution, and a robust governance structure, LetsBonk.fun has risen to platform-level prominence within the meme coin ecosystem, gradually replacing Pump.fun as the new growth engine of this market cycle. Moving forward, whether it can continue to launch flagship projects, expand its ecosystem diversity, and maintain a positive feedback loop for capital inflow will determine if it can solidify and extend its leadership position.
Overview of Popular Token Data
$ENA —— ENA is the native token of Ethena, a decentralized yield-dollar protocol built on Ethereum. Ethena aims to provide an alternative to traditional stablecoins through USDe—a synthetic on-chain asset backed by a combination of collateral and hedged positions. By integrating exchange-based derivatives with on-chain liquidation mechanisms, USDe establishes a stable structure that operates independently of the traditional banking system. ENA is primarily used for staking rewards, protocol governance, and ecosystem incentives. With growing TVL and yield, Ethena has emerged as a yield-centric innovator within the stablecoin sector.
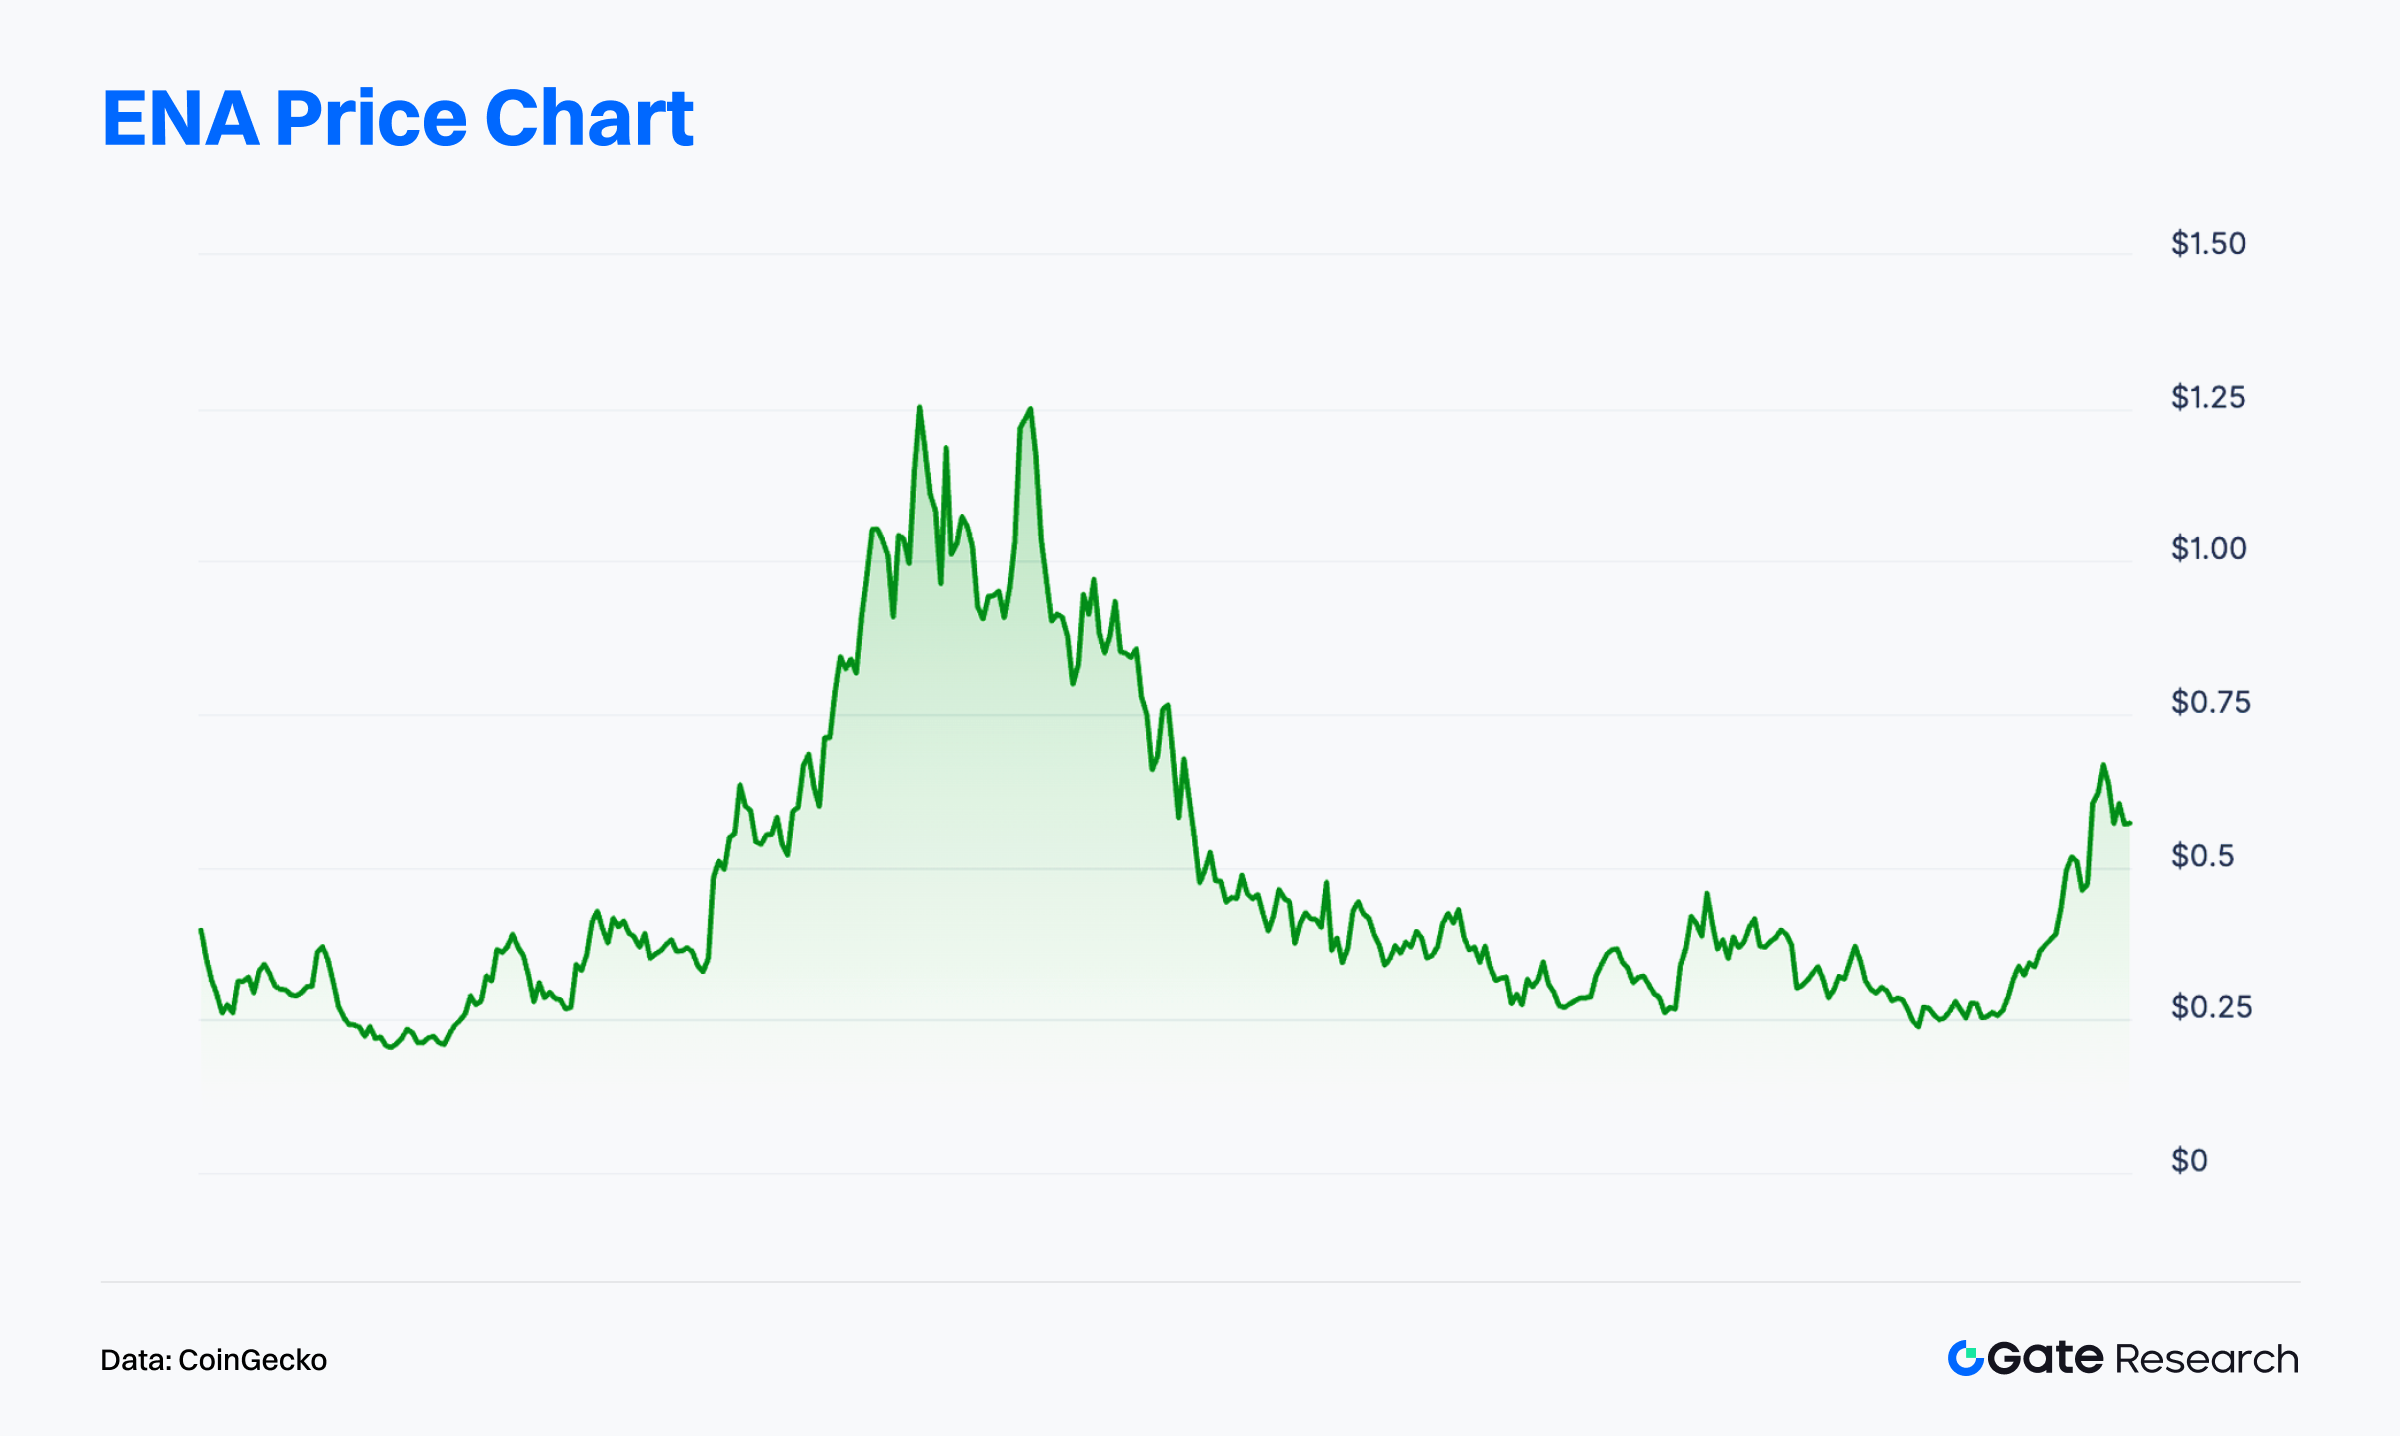
Since late June, ENA has surged over 110%, reaching a peak of $0.69, making it one of the best-performing tokens recently. On July 24, Ethena announced a strategic partnership with Anchorage Digital—the only federally chartered crypto bank in the U.S. Anchorage will assist Ethena in launching a compliant stablecoin, USDtb, in the U.S. under the regulatory framework provided by the GENIUS Act, offering institutional investors a secure and compliant way to access USD exposure.
In addition, the Ethena Foundation disclosed on July 27 that its subsidiary had repurchased 83 million ENA from the open market via third-party market makers between July 22 and 25.【15】This move not only signals strong long-term confidence in ENA from the team but also strengthened short-term price expectations and support.
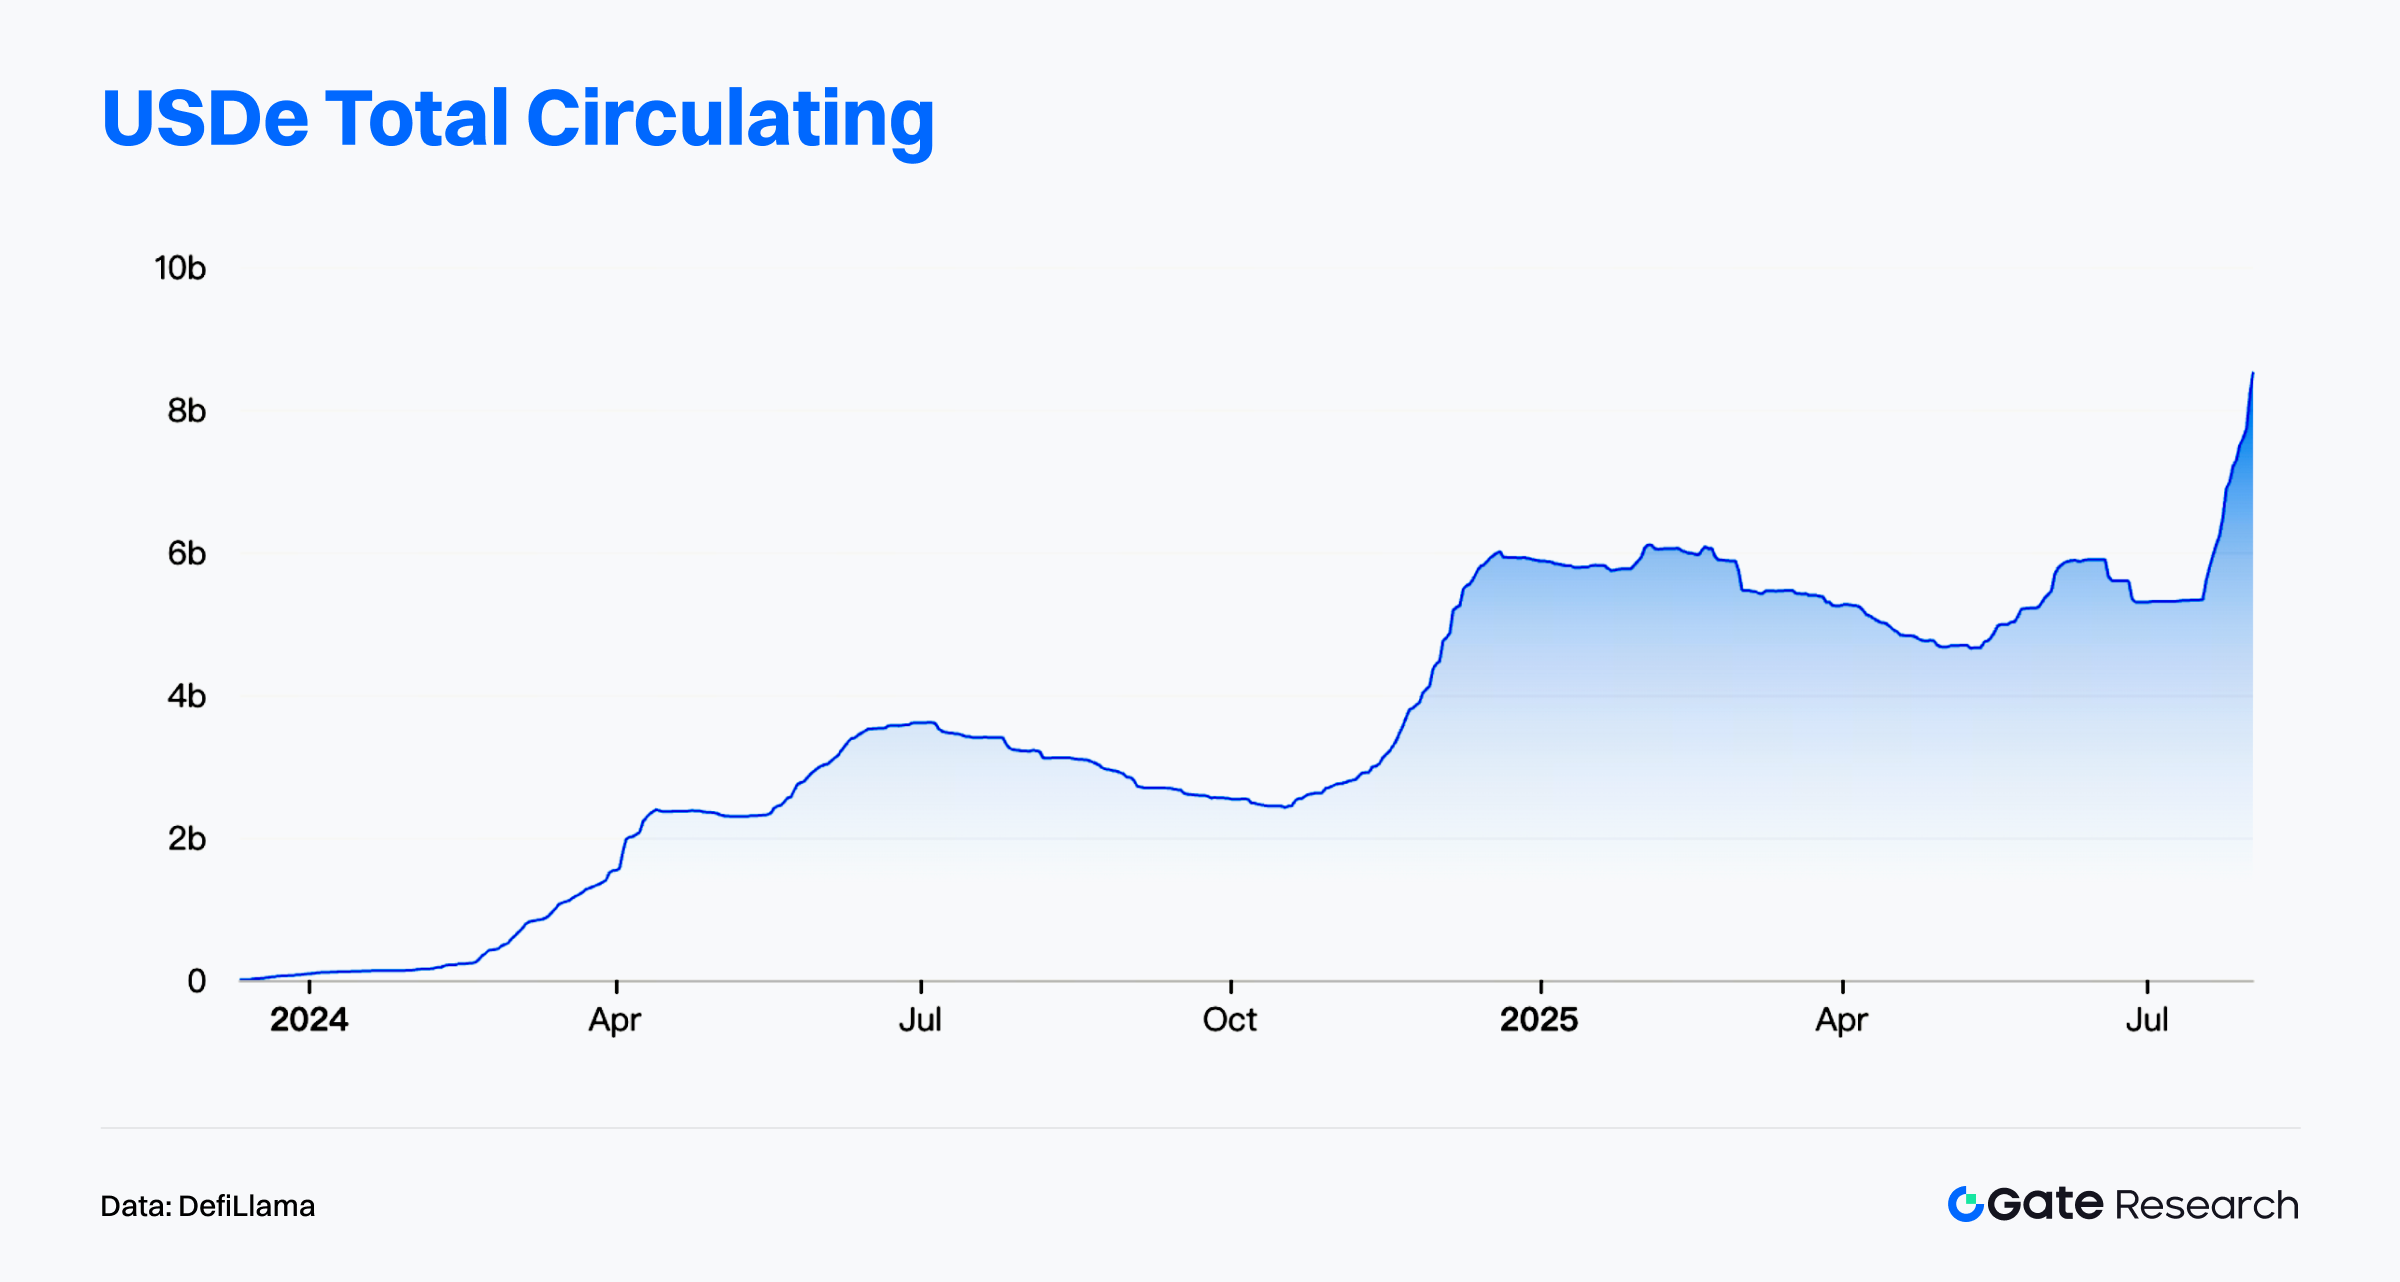
According to DefiLlama, USDe issuance saw explosive growth in July. As of July 31, total supply surpassed $8.2 billion, representing a 40% year-to-date increase. While 96.28% of circulation remains on Ethereum mainnet, emerging chains such as TON and Mantle have begun absorbing liquidity—demonstrating the protocol’s initial cross-chain expansion and ecosystem spillover effects. Meanwhile, USDe’s staking ratio has rebounded from its yearly lows to around 60%, still below historical highs but indicating renewed user confidence in the protocol’s stability and yield mechanisms.【16】
As of July 31, Ethena’s total value locked (TVL) exceeded $8.4 billion, ranking it among the top stablecoin protocols across all chains. The protocol currently generates $609 million in annualized fees and $123 million in annualized yield—demonstrating a highly sustainable revenue structure. These strong fundamentals underpin ENA’s recent price strength and future growth potential.
One notable upcoming event is the August 2 token unlock, which will release approximately 40.63 million ENA (about 0.64% of circulating supply), with an estimated market value of $23.18 million at current prices. Although this unlock represents a relatively small portion of the supply, it may introduce short-term market volatility amid the ongoing uptrend. Whether the team continues repurchasing tokens or guides liquidity in a supportive direction will be a key point of market attention.【17】
In summary, Ethena has firmly established itself as a leading protocol in the stablecoin sector, driven by its innovative mechanism, sound financial structure, and proactive ecosystem expansion. The continued growth in USDe issuance and staking, coupled with ENA buybacks and institutional partnerships, reflects the team’s clear strategic vision for value capture and sustainable development. While near-term volatility may arise from the upcoming token unlock, Ethena’s solid fundamentals and growing market recognition remain the core drivers of ENA’s ongoing rally. Going forward, the protocol’s ability to expand cross-chain presence and enhance real yield generation will be critical in determining ENA’s long-term valuation ceiling.
Conclusion
In July 2025, on-chain data revealed a clear pattern of structural divergence across blockchain ecosystems. Ethereum recorded a new all-time high in transaction volume. While it lacks an edge in interaction frequency, it continues to dominate in fee revenue thanks to its high-value use cases, attracting steady capital inflows. This further solidifies Ethereum’s strategic role as the sovereign settlement layer in the crypto ecosystem. Solana and Base, on the other hand, stood out for their high-frequency interaction and ecosystem stability, respectively. Both chains led in transaction volume and active user count, showcasing strong user stickiness and real-world application traction. Meanwhile, emerging chains like WorldChain are rapidly building capital and user bases through identity protocols and cross-chain mechanisms, positioning themselves as strong contenders for the next phase of public chain leadership.
Bitcoin, too, is sending structurally bullish on-chain signals. Its realized market cap reached a new all-time high, demonstrating robust capital absorption capacity. Even a large-scale distribution event recently failed to trigger a systemic price correction. However, concentrated profit-taking and a loosening of the holding structure may introduce short-term supply pressure, potentially leading to a period of market consolidation. Overall, the structural on-chain setup continues to support a bullish outlook, but with sector rotations accelerating, precise capital and user allocation will be key to staying ahead of the market cycle.
Among project highlights, LetsBonk.fun and Ethena have emerged as two of the most closely watched protocols: LetsBonk.fun, a new meme coin launch platform in the Solana ecosystem, quickly overtook Pump.fun with breakout tokens like USELESS, capturing over 70% of the token launch market share. The platform’s total market cap once approached $1 billion, and its transparent revenue-sharing model has strengthened community loyalty. Ethena, meanwhile, expanded rapidly through its yield-bearing stablecoin USDe, with TVL surging to $8.4 billion and annualized protocol earnings exceeding $120 million. Its token ENA has gained over 110% since late June, driven by buybacks and regulatory breakthroughs—positioning Ethena as one of the most promising projects in the stablecoin sector.
References:
- Artemis, https://app.artemisanalytics.com/chains
- Artemis, https://app.artemisanalytics.com/chains
- Artemis, https://app.artemisanalytics.com/chains
- Artemis, https://app.artemisanalytics.com/flows
- DefiLlama, https://defillama.com/protocol/world-chain
- Glassnode, https://studio.glassnode.com/charts/ba1ec93d-85f4-41fe-5606-798a2f30013a?s=0&u=1753798907
- Glassnode, https://studio.glassnode.com/charts/dea4aa9d-b268-45d2-6c65-fbd1f8a5807c?s=1596032506&u=1753798906
- Glassnode, https://studio.glassnode.com/charts/ca4b13c0-8814-4083-4a1a-37fecbcc7693?s=0&u=1753798920
- Glassnode, https://studio.glassnode.com/charts/680b84b2-2796-43a0-7194-37d43f01bce9?s=1532874151&u=1753798951
- Dune, https://dune.com/adam_tehc/memecoin-wars
- Dune, https://dune.com/oladee/lets-bonk
- HolderScan, https://holderscan.com/token/Dz9mQ9NzkBcCsuGPFJ3r1bS4wgqKMHBPiVuniW8Mbonk
- X, https://x.com/OnchainLens/status/1945007556067459425
- Letsbonk.fun, https://revenue.letsbonk.fun/
- X, https://x.com/EthenaFndtn/status/1949191161375273241
- Dune, https://dune.com/hashed_official/ethena
- Tokenomist, https://tokenomist.ai/ethena
Gate Research is a comprehensive blockchain and cryptocurrency research platform that provides deep content for readers, including technical analysis, market insights, industry research, trend forecasting, and macroeconomic policy analysis.
Disclaimer
Investing in cryptocurrency markets involves high risk. Users are advised to conduct their own research and fully understand the nature of the assets and products before making any investment decisions. Gate is not responsible for any losses or damages arising from such decisions.
Related Articles

Reflections on Ethereum Governance Following the 3074 Saga

Gate Research: BTC Breaks $100K Milestone, November Crypto Trading Volume Exceeds $10 Trillion For First Time

NFTs and Memecoins in Last vs Current Bull Markets

Gate Research: 2024 Cryptocurrency Market Review and 2025 Trend Forecast

Detailed Analysis of the FIT21 "Financial Innovation and Technology for the 21st Century Act"
