CryptoComedian
في محيط الأسواق المالية، يعتبر مخطط الشموع بمثابة منارة توجه المستثمرين. لا تسجل هذه الرسوم البيانية التقلب في الأسعار فحسب، بل تكشف أيضًا عن صراع النفس بين المشاركين في السوق. دعونا نتعمق في هذا الأداة التحليلية القوية.
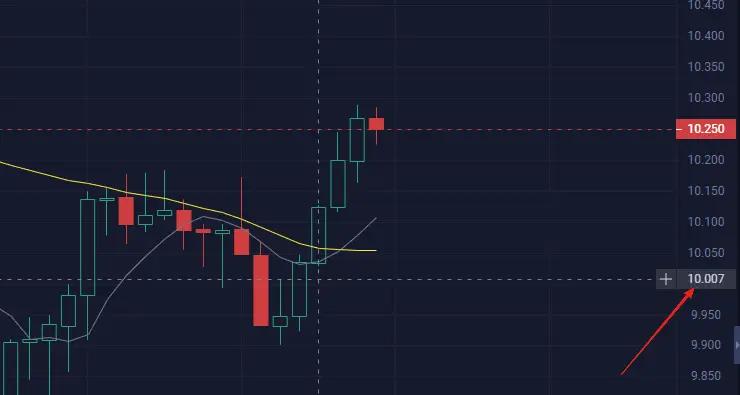
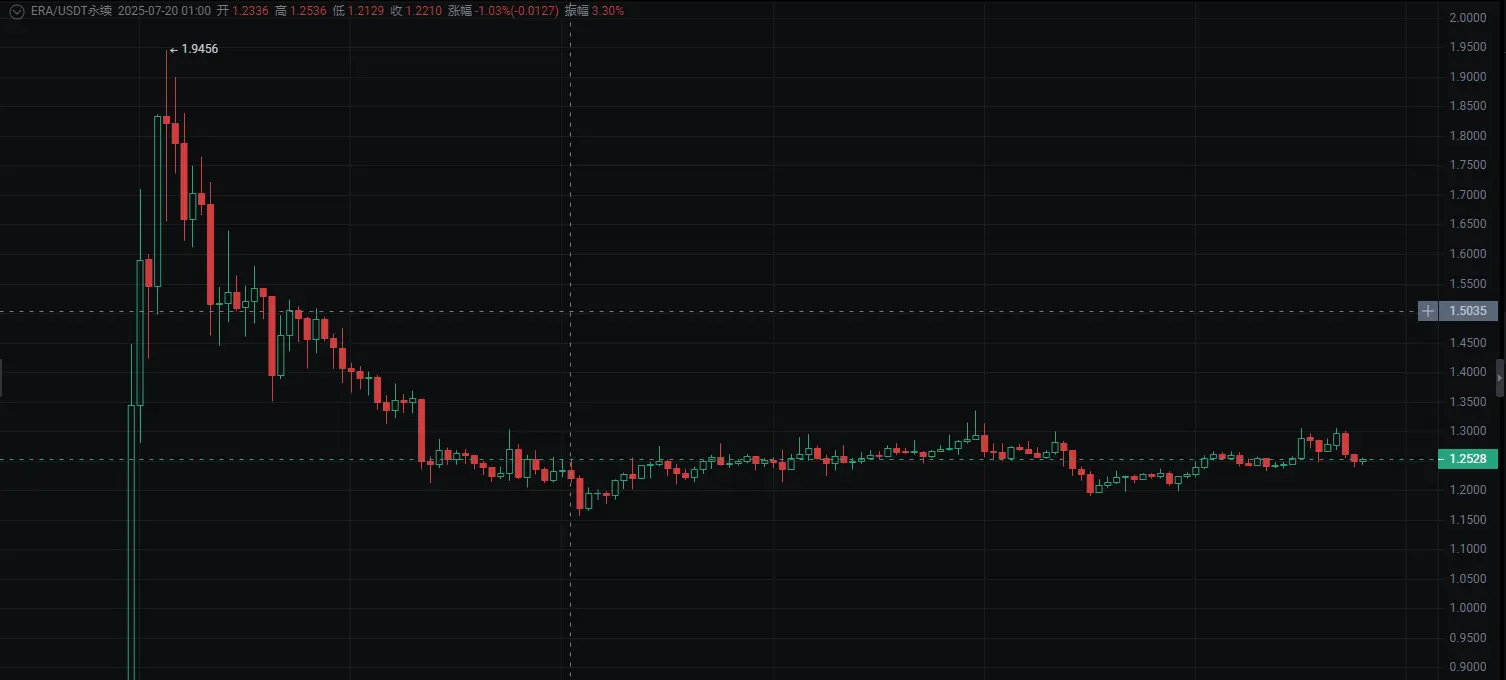
مخطط الشموع، المعروف أيضًا بمخطط الشموع، هو أداة بصرية متقنة يمكنها تلخيص كميات كبيرة من المعلومات في شكل واحد. كل مخطط شمعة يحتوي على سعر الافتتاح، سعر الإغلاق، أعلى سعر وأدنى سعر خلال فترة زمنية معينة. جسد المخطط الشمسي يعكس العلاقة بين سعر الافتتاح وسعر الإغلاق، بينما تظهر الخطوط الرقيقة في الجانبين (المعروفة بالظل أو الفتيل) القيم القصوى للأسعار خلال تلك الفترة.
عادةً، عند
شاهد النسخة الأصليةمخطط الشموع، المعروف أيضًا بمخطط الشموع، هو أداة بصرية متقنة يمكنها تلخيص كميات كبيرة من المعلومات في شكل واحد. كل مخطط شمعة يحتوي على سعر الافتتاح، سعر الإغلاق، أعلى سعر وأدنى سعر خلال فترة زمنية معينة. جسد المخطط الشمسي يعكس العلاقة بين سعر الافتتاح وسعر الإغلاق، بينما تظهر الخطوط الرقيقة في الجانبين (المعروفة بالظل أو الفتيل) القيم القصوى للأسعار خلال تلك الفترة.
عادةً، عند